データ駆動型の意思決定が重要性を増す現代のビジネス環境において、時系列予測は欠かせないスキルとなっています。
売上予測、需要予測、在庫管理など、様々な場面で活用される時系列予測。しかし、その複雑さゆえに敬遠されがちなのも事実です。
そこで注目したいのが、Pythonライブラリ「mlforecast」です。高速で使いやすく、かつ高精度な予測が可能なこのツールは、時系列予測の新たな扉を開きます。
初心者にも優しく、エキスパートにも満足の機能を備えたmlforecastを使えば、これまで難しいと思われていた時系列予測が、驚くほど身近なものになるでしょう。
今回は、mlforecastの特徴や基本的な使い方を解説します。
Contents [hide]
- はじめに
- 時系列予測の重要性
- mlforecastとは何か
- mlforecastの特徴と構築可能なモデル
- mlforecastの主な特徴
- 高速な処理
- 自動的なハイパーパラメータ最適化
- 複数モデルのアンサンブル
- 扱いやすいAPI
- mlforecastで構築できるモデル(2024年10月18日現在)
- インストールと基本的な使用方法
- インストール方法
- 基本的な使用方法
- データの準備
- モデルの学習
- 予測の実行
- 結果の可視化
- 複数モデルを実装する
- データの準備
- モデルの学習
- 予測の実行
- 結果の可視化
- ハイパーパラメータチューニングしモデル構築
- データの準備
- ハイパーパラメータの自動調整
- モデルの学習
- 予測の実行
- 結果の可視化
- まとめ
はじめに
時系列予測の重要性
ビジネスの世界では、未来を予測することが成功の鍵となります。売上予測、需要予測、在庫管理、リソース配分など、多くの重要な意思決定が将来の見通しに基づいて行われています。
この「未来を見通す」ための強力なツールが、時系列予測です。
時系列予測とは、過去のデータパターンを分析し、それを基に将来の値を予測する技術です。
例えば……
- 小売業での週次売上予測
- 製造業での月次生産量予測
- エネルギー業界での電力需要予測
- 金融市場での株価変動予測
これらはすべて、時系列予測の応用例です。適切な予測は、リスクの軽減、効率の向上、そして最終的には収益の増加につながります。
mlforecastとは何か
時系列予測の重要性は明白ですが、その実施には高度な統計知識や複雑なプログラミングスキルが必要とされることが多く、多くの実務者にとって障壁となっていました。
ここで登場するのが「mlforecast」です。
mlforecastは、Pythonで書かれた時系列予測ライブラリで、以下のような特徴を持っています。
- 使いやすさ: シンプルなAPIで、複雑な時系列モデルを簡単に構築できます。
- 高速性: 大規模なデータセットでも高速に動作します。
- 柔軟性: 複数のモデルを組み合わせたアンサンブル学習をサポートしています。
mlforecastを使用することで、データサイエンティストだけでなく、ビジネスアナリストや開発者も、高度な時系列予測を手軽に実行できるようになります。
mlforecastの特徴と構築可能なモデル
mlforecastの主な特徴
mlforecastは、時系列予測を効率的かつ効果的に行うための様々な特徴を備えています。
高速な処理
mlforecastは、大規模なデータセットや複数の時系列を扱う際に特に威力を発揮します。
内部で最適化されたアルゴリズムと並列処理を活用することで、従来の手法と比べて格段に高速な処理を実現しています。
これにより、リアルタイムに近い予測や、大量の時系列データを扱う企業での使用が可能になります。
自動的なハイパーパラメータ最適化
時系列モデルの性能は、適切なハイパーパラメータの選択に大きく依存します。
mlforecastは、scikit-learn互換のモデルを使用できるため、ベイズ最適化などの外部ライブラリ(例えばOptuna)と組み合わせることで、自動的にハイパーパラメータを調整することが可能です。
これにより、ユーザーは複雑なパラメータチューニングのプロセスを外部ツールに任せ、モデルの性能向上に集中できます。
複数モデルのアンサンブル
単一のモデルよりも、複数のモデルを組み合わせたアンサンブルモデルの方が、多くの場合より高い予測精度を示します。
mlforecastは、様々な時系列モデルを簡単に組み合わせることができる機能を提供しています。
これにより、各モデルの長所を活かしつつ、より堅牢で精度の高い予測が可能になります。
扱いやすいAPI
mlforecastは、scikit-learnライクなAPIを採用しています。
これにより、Pythonでのデータ分析に慣れているユーザーは、スムーズにmlforecastを使い始めることができます。
fit()メソッドでモデルを学習し、predict()メソッドで予測を行うという直感的な使い方が可能です。
mlforecastで構築できるモデル(2024年10月18日現在)
mlforecastは、様々な時系列予測モデルをサポートしています。主なモデルを紹介します。
以下は、MLForecastで使用可能なモデルの一部です。
| モデル名 | モデルの種類 | 説明 |
|---|---|---|
| LinearRegression | 線形回帰 | scikit-learnの線形回帰モデル。単純な線形モデルを使って予測を行います。 |
| Ridge | 線形回帰(正則化) | L2正則化を含む線形回帰。過学習を抑制します。 |
| Lasso | 線形回帰(正則化) | L1正則化を含む線形回帰。特徴選択が可能です。 |
| ElasticNet | 線形回帰(正則化) | L1とL2正則化のバランスを取ったモデルです。 |
| RandomForestRegressor | アンサンブル学習 | 決定木ベースのアンサンブル学習による予測モデル。 |
| XGBoost | 勾配ブースティング | 非線形の時系列予測に優れた、勾配ブースティングアルゴリズム。 |
| LightGBM | 勾配ブースティング | XGBoostに類似した高速なモデル。大規模データに適しています。 |
| CatBoost | 勾配ブースティング | カテゴリカル変数の扱いに強い、CatBoostの勾配ブースティングモデル。 |
| SVR | サポートベクターマシン | 時系列データの回帰にサポートベクターマシンを使用。 |
これらに加え、scikit-learn互換の任意の回帰モデルを使用でき、カスタムモデルや独自のアルゴリズムを組み込むことも可能です。
これらのモデルを単独で使用したり、組み合わせてアンサンブルモデルを構築したりすることで、様々な時系列データに対応できます。
同様な感じで、ARIMAなどの時系列モデルを統一のインターフェースで構築するときは、StatsForecastライブラリを利用するといいです。
ハイパーパラメータ調整を自動で実施する、以下の自動予測モデル構築機能があります(2023年4月15日現在)。
- AutoARIMA
- AutoETS
- AutoCES
- AutoTheta
使い方などは以下の記事で解説しています。
インストールと基本的な使用方法
インストール方法
mlforecastは、Pythonのパッケージ管理システムであるpipを使って簡単にインストールできます。
以下、コードです。
pip install mlforecast
これで、mlforecastとその依存パッケージがインストールされます。
基本的な使用方法
mlforecastの基本的な使用方法を、簡単な例を通して説明します。
データの準備
まず、必要なライブラリをインポートし、サンプルデータを準備します。
以下、コードです。
import pandas as pd
import numpy as np
from mlforecast import MLForecast
from sklearn.ensemble import RandomForestRegressor

# サンプルデータの作成
dates = pd.date_range(start='2020-01-01', end='2022-12-31', freq='D')
np.random.seed(42)
values = np.random.randn(len(dates)).cumsum() + 100
df = pd.DataFrame({'unique_id': 0, 'ds': dates, 'y': values})

print(df)
このコードでは、2年分の日次データを生成しています。
以下、実行結果です。
      unique_id         ds           y
0             0 2020-01-01  100.496714
1             0 2020-01-02  100.358450
2             0 2020-01-03  101.006138
3             0 2020-01-04  102.529168
4             0 2020-01-05  102.295015
...         ...        ...         ...
1091          0 2022-12-27  134.574747
1092          0 2022-12-28  135.302377
1093          0 2022-12-29  135.354323
1094          0 2022-12-30  136.086963
1095          0 2022-12-31  136.006246

[1096 rows x 3 columns]
unique_idはデータセット内の各エントリを一意に識別するためのIDです。このデータセットでは、unique_idはすべての行で同じ値(0)を持っているため、単一の時系列データを表しています。複数の時系列データを扱う場合、unique_idはそれぞれの時系列を区別するために異なる値を持つことがあります。
dsは日付を表す列で、時系列データのタイムスタンプとして機能します。yは観測された値を表す列で、時系列データの実際の値を示しています。
モデルの学習
次に、モデルのインスタンスの作成し、データを学習させます。
# モデルのインスタンスの作成
model = MLForecast(
    models=[
        RandomForestRegressor(n_estimators=100, max_depth=5)
    ],
    freq='D',
    lags=[1, 7, 28],
    date_features=['dayofweek', 'month'],
)

# モデルの学習
model.fit(df,fitted=True)
このコードでは、ランダムフォレストモデルを使用し、1日前、7日前、28日前のラグ特徴量と、曜日と月のカレンダー特徴量を使用しています。
予測の実行
モデルの学習が完了したら、将来の予測を行います。
# 30日分の予測
predictions = model.predict(30)

print(predictions)
このコードでは、2023年1月の30日分の予測を行っています。
以下、実行結果です。
    unique_id         ds  RandomForestRegressor
0           0 2023-01-01             135.326314
1           0 2023-01-02             135.203679
2           0 2023-01-03             135.194232
3           0 2023-01-04             135.274755
4           0 2023-01-05             135.311591
5           0 2023-01-06             135.399517
6           0 2023-01-07             135.387266
7           0 2023-01-08             135.134569
8           0 2023-01-09             135.300010
9           0 2023-01-10             135.309458
10          0 2023-01-11             135.345713
11          0 2023-01-12             135.373102
12          0 2023-01-13             135.373102
13          0 2023-01-14             135.362931
14          0 2023-01-15             135.134569
15          0 2023-01-16             135.238500
16          0 2023-01-17             135.247947
17          0 2023-01-18             135.284202
18          0 2023-01-19             135.311591
19          0 2023-01-20             135.311591
20          0 2023-01-21             135.301420
21          0 2023-01-22             135.073059
22          0 2023-01-23             135.238500
23          0 2023-01-24             135.247947
24          0 2023-01-25             135.284202
25          0 2023-01-26             135.311591
26          0 2023-01-27             135.311591
27          0 2023-01-28             135.301420
28          0 2023-01-29             135.073059
29          0 2023-01-30             135.238500
結果の可視化
最後に、予測結果を可視化してみましょう。
import matplotlib.pyplot as plt

# 学習データのモデルの適合値(予測値)
predictions_train = model.forecast_fitted_values()

# グラフの描画
plt.figure(figsize=(12, 6))
plt.plot(
    df['ds'],
    df['y'],
    label='Actual Value'
)
plt.plot(
    predictions['ds'],
    predictions['RandomForestRegressor'],
    label='Future Prediction'
)
plt.plot(
    predictions_train['ds'],
    predictions_train['RandomForestRegressor'],
    label='Fitted Values',
    linestyle=':',
)
plt.legend()
plt.title('Time Series Forecast Result')
plt.xlabel('Date')
plt.ylabel('Value')
plt.show()
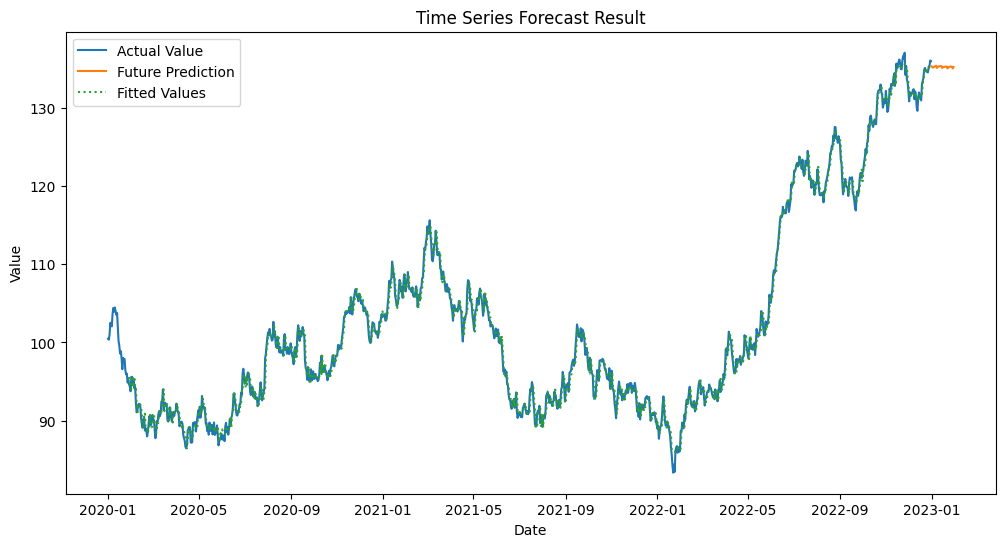
このコードで、実際の値と予測値を同じグラフ上にプロットします。
以下、実行結果です。

複数モデルを実装する
mlforecastの強力な機能の1つは、複数のモデルを簡単に組み合わせて使用できることです。これにより、各モデルの長所を活かしながら、より堅牢で精度の高い予測を行うことができます。
ここでは、xgboostとlightgbmの機械学習モデルを使います。ライブラリをインストールされていない方は、以下のコードでインストールしておいてください。
pip install xgboost lightgbm
データの準備
では、必要なライブラリをインポートし、サンプルデータを準備します。
以下、コードです。
import pandas as pd
import numpy as np
from mlforecast import MLForecast
from sklearn.ensemble import RandomForestRegressor
from xgboost import XGBRegressor
from lightgbm import LGBMRegressor
import matplotlib.pyplot as plt

# サンプルデータの作成
dates = pd.date_range(start='2020-01-01', end='2022-12-31', freq='D')
np.random.seed(42)
values = np.random.randn(len(dates)).cumsum() + 100
df = pd.DataFrame({'unique_id': 0, 'ds': dates, 'y': values})
このサンプルデータは、前回と同じものです。
モデルの学習
次に、モデルのインスタンスの作成し、データを学習させます。
# モデルのインスタンスのリスト
models = [
    # RandomForestモデル
    RandomForestRegressor(
        n_estimators=100,
        max_depth=5
    ),
    # XGBoostモデル
    XGBRegressor(
        n_estimators=100,
        max_depth=5,
        learning_rate=0.1
    ),
    # LightGBMモデル
    LGBMRegressor(
        n_estimators=100,
        max_depth=5,
        learning_rate=0.1
    ),
]

# モデルのインスタンスの作成
model = MLForecast(
    models=models,
    freq='D',
    lags=[1, 7, 28],
    date_features=['dayofweek', 'month', 'year'],
    num_threads=4
)

# モデルの学習
model.fit(df,fitted=True)
この例では、RandomForest、XGBoost、LightGBMの3つのモデルを使用しています。
予測の実行
モデルの学習が完了したら、将来の予測を行います。
# 30日分の予測
predictions = model.predict(30)

print(predictions)
このコードでは、2023年1月の30日分の予測を行っています。
以下、実行結果です。
    unique_id         ds  RandomForestRegressor  XGBRegressor  LGBMRegressor
0           0 2023-01-01             135.501239    131.677063     133.171089
1           0 2023-01-02             135.314719    130.916245     131.217346
2           0 2023-01-03             135.217894    130.948029     130.134795
3           0 2023-01-04             135.265313    130.522568     129.892645
4           0 2023-01-05             135.294938    130.173523     129.466797
5           0 2023-01-06             135.448755    130.227463     129.489638
6           0 2023-01-07             135.506596    130.173477     129.511516
7           0 2023-01-08             135.307949    130.172714     129.363823
8           0 2023-01-09             135.309292    130.453522     129.126934
9           0 2023-01-10             135.271288    130.420609     127.684989
10          0 2023-01-11             135.319379    130.327560     126.998208
11          0 2023-01-12             135.349004    130.146729     126.340748
12          0 2023-01-13             135.343333    130.295425     126.428551
13          0 2023-01-14             135.343333    130.393280     126.538232
14          0 2023-01-15             135.264915    130.275970     126.272521
15          0 2023-01-16             135.235685    130.416061     126.173545
16          0 2023-01-17             135.235685    130.383148     126.338724
17          0 2023-01-18             135.254325    130.368607     126.363262
18          0 2023-01-19             135.283951    130.162933     126.308163
19          0 2023-01-20             135.283951    130.350525     126.308163
20          0 2023-01-21             135.283951    130.444000     126.450428
21          0 2023-01-22             135.189719    130.326691     126.156587
22          0 2023-01-23             135.235685    130.432449     126.140961
23          0 2023-01-24             135.235685    130.399536     126.289954
24          0 2023-01-25             135.254325    130.384995     126.314493
25          0 2023-01-26             135.283951    130.162933     126.308163
26          0 2023-01-27             135.283951    130.070068     126.308163
27          0 2023-01-28             135.283951    129.231842     126.450428
28          0 2023-01-29             135.189719    127.180542     126.156587
29          0 2023-01-30             135.235685    126.886238     126.228764
結果の可視化
最後に、予測結果を可視化してみましょう。
# 学習データのモデルの適合値(予測値)
predictions_train = model.forecast_fitted_values()

# グラフの描画
fig, axs = plt.subplots(3, 1, figsize=(12, 18))

# モデル情報のリスト
models_info = [
    {'name': 'RandomForestRegressor', 'title': 'Random Forest'},
    {'name': 'XGBRegressor', 'title': 'XGBoost'},
    {'name': 'LGBMRegressor', 'title': 'LightGBM'}
]

# モデルのプロット
for ax, model_info in zip(axs, models_info):
    model_name = model_info['name']
    ax.plot(
        df['ds'],
        df['y'],
        label='Actual Value'
    )
    ax.plot(
        predictions['ds'],
        predictions[model_name],
        label=f'{model_name} Future Prediction'
    )
    ax.plot(
        predictions_train['ds'],
        predictions_train[model_name],
        label=f'{model_name} Fitted Values',
        linestyle=':',
    )
    ax.legend()
    ax.set_title(model_info['title'])
    ax.set_xlabel('Date')
    ax.set_ylabel('Value')

plt.tight_layout()
plt.show()
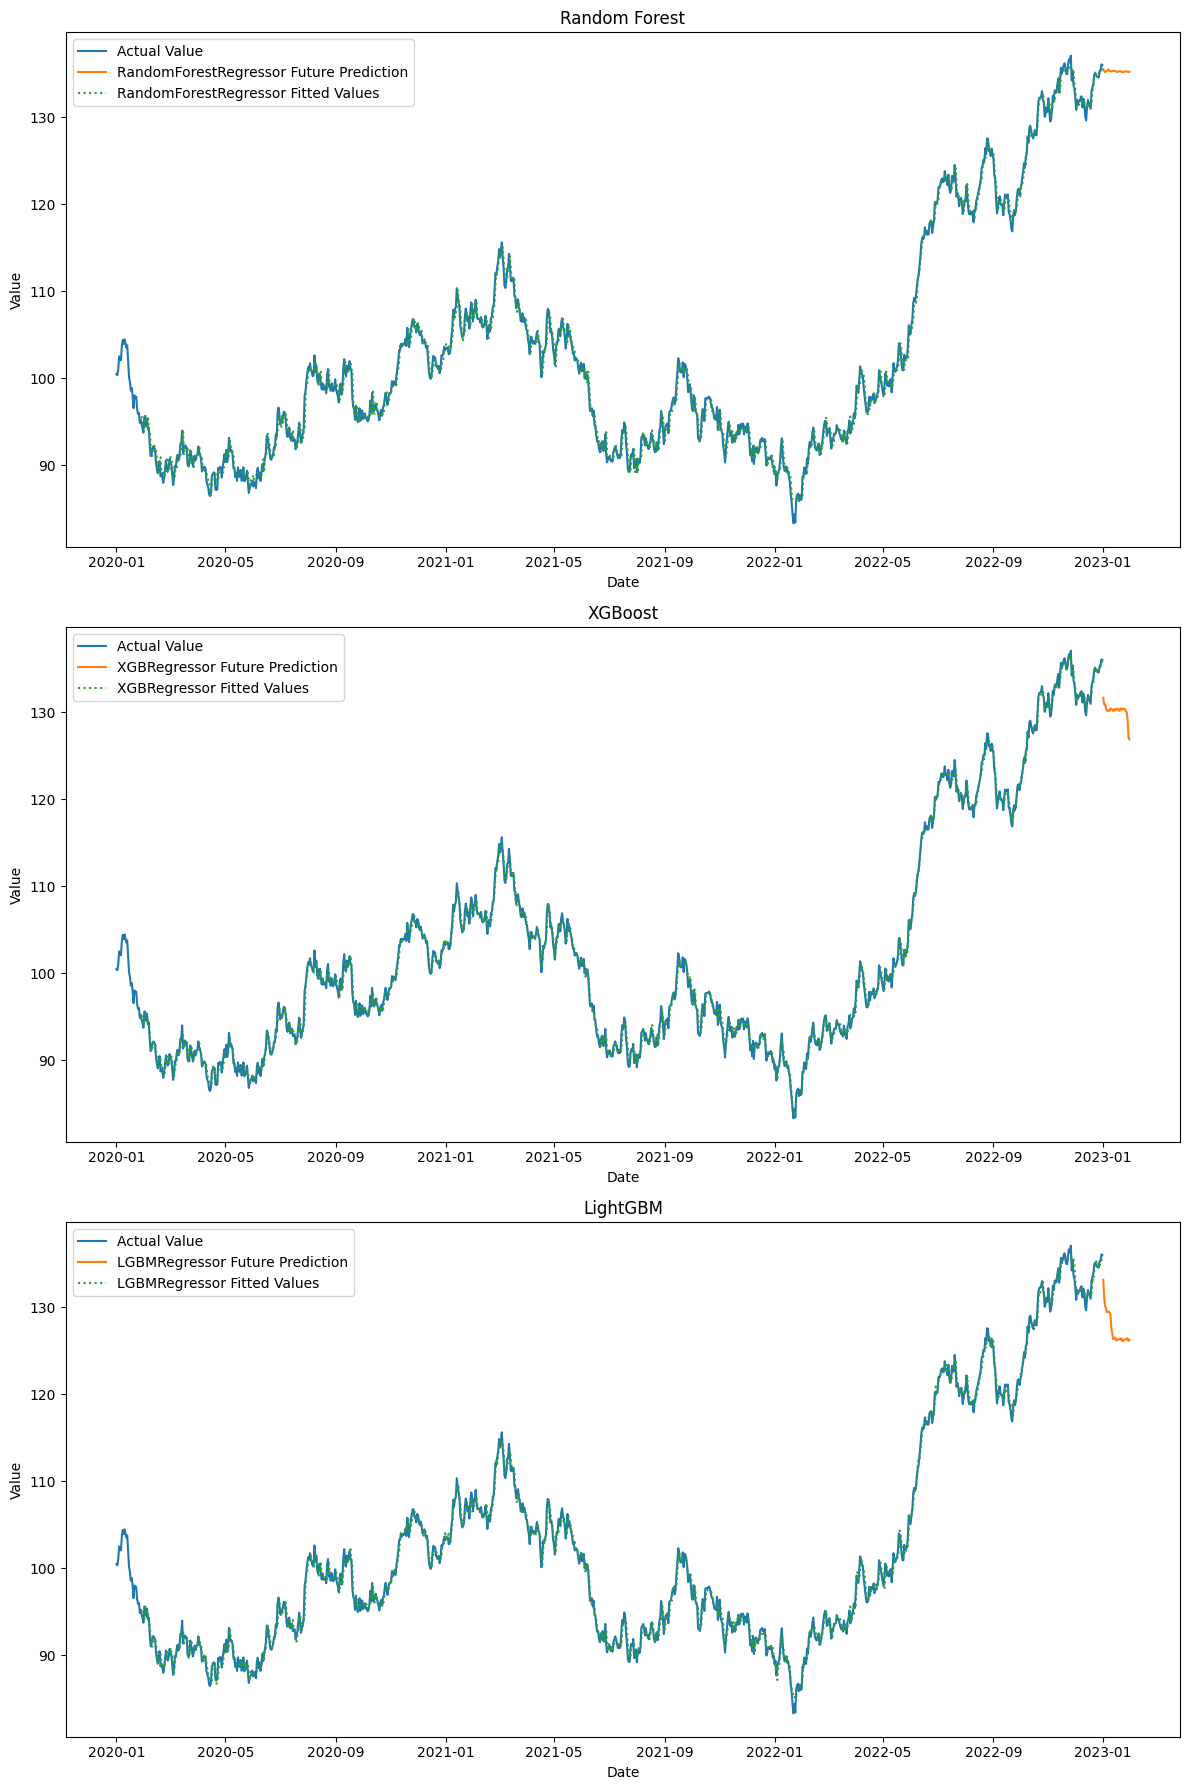
このコードで、実際の値と予測値を同じグラフ上にプロットします。
以下、実行結果です。

ハイパーパラメータチューニングしモデル構築
機械学習のモデルにはハイパーパラメータ(モデルを構築する人が設定)が存在します。Optunaを利用することで、自動調整してくれます。
Optunaのライブラリをインストールされていない方は、以下のコードでインストールしておいてください。
pip install optuna
データの準備
先ず、必要なライブラリをインポートし、サンプルデータを準備します。
以下、コードです。
import pandas as pd
import numpy as np
from mlforecast import MLForecast
from sklearn.ensemble import RandomForestRegressor
from xgboost import XGBRegressor
from lightgbm import LGBMRegressor
import matplotlib.pyplot as plt

# サンプルデータの作成
dates = pd.date_range(start='2020-01-01', end='2022-12-31', freq='D')
np.random.seed(42)
values = np.random.randn(len(dates)).cumsum() + 100
df = pd.DataFrame({'unique_id': 0, 'ds': dates, 'y': values})
このサンプルデータは、前回と同じものです。
ハイパーパラメータの自動調整
今回は、LightGBMモデルを構築します。Optunaの使い方などは、以下を参考にしてください。
以下、コードです。
# ハイパーパラメータ調整時の検証データ
true_values = df['y'][-15:]

# 目的関数を定義
def objective(trial):
    # 探索ハイパーパラメータとその範囲を設定
    params = {
        'num_leaves': trial.suggest_int('num_leaves', 20, 50),
        'learning_rate': trial.suggest_float('learning_rate', 0.01, 0.1),
        'n_estimators': trial.suggest_int('n_estimators', 50, 200)
    }

    # モデルのインスタンスを作成
    model = lgb.LGBMRegressor(**params, verbose=-1)
    forecast = MLForecast(
        models=[model],
        freq='D',
        lags=[1, 7, 14]
    )

    # モデルの学習
    forecast.fit(df[:-15])

    # 次の15データポイントを予測
    predictions = forecast.predict(15)

    # MSEを使用して評価
    mse = mean_squared_error(true_values, predictions['LGBMRegressor'])

    return mse

# Optunaで最適化
study = optuna.create_study(direction='minimize')
study.optimize(objective, n_trials=100, show_progress_bar=True)

# 最適なハイパーパラメータを出力
print(study.best_params)
以下、実行結果です。
Best trial: 57. Best value: 11.4827: 100%|██████████| 100/100 [00:10<00:00,  9.92it/s]
{'num_leaves': 26, 'learning_rate': 0.03613704080532945, 'n_estimators': 188}
モデルの学習
最適なハイパーパラメータを設定したモデルのインスタンスの作成し、データを学習させます。
# モデルのインスタンスのリスト
models = [lgb.LGBMRegressor(**study.best_params, verbose=-1)]

# モデルのインスタンスの作成
model = MLForecast(
    models=models,
    freq='D',
    lags=[1, 7, 28],
    date_features=['dayofweek', 'month', 'year'],
    num_threads=4
)

# モデルの学習
model.fit(df, fitted=True)
予測の実行
モデルの学習が完了したら、将来の予測を行います。
# 30日分の予測
predictions = model.predict(30)

print(predictions)
このコードでは、2023年1月の30日分の予測を行っています。
以下、実行結果です。
    unique_id         ds  LGBMRegressor
0           0 2023-01-01     133.222935
1           0 2023-01-02     131.657712
2           0 2023-01-03     130.453678
3           0 2023-01-04     129.987232
4           0 2023-01-05     129.528451
5           0 2023-01-06     129.582311
6           0 2023-01-07     129.747000
7           0 2023-01-08     129.586512
8           0 2023-01-09     129.434648
9           0 2023-01-10     129.552650
10          0 2023-01-11     129.567937
11          0 2023-01-12     129.456898
12          0 2023-01-13     129.478323
13          0 2023-01-14     129.676251
14          0 2023-01-15     129.483448
15          0 2023-01-16     129.574148
16          0 2023-01-17     129.684551
17          0 2023-01-18     129.518708
18          0 2023-01-19     129.456898
19          0 2023-01-20     129.429094
20          0 2023-01-21     129.627022
21          0 2023-01-22     129.434218
22          0 2023-01-23     129.574148
23          0 2023-01-24     129.684551
24          0 2023-01-25     129.518708
25          0 2023-01-26     129.456898
26          0 2023-01-27     129.429094
27          0 2023-01-28     129.627022
28          0 2023-01-29     129.434218
29          0 2023-01-30     129.623377
結果の可視化
最後に、予測結果を可視化してみましょう。
# 学習データのモデルの適合値(予測値)
predictions_train = model.forecast_fitted_values()

# グラフの描画
plt.figure(figsize=(12, 6))
plt.plot(
    df['ds'],
    df['y'],
    label='Actual Value'
)
plt.plot(
    predictions['ds'],
    predictions['LGBMRegressor'],
    label='Future Prediction'
)
plt.plot(
    predictions_train['ds'],
    predictions_train['LGBMRegressor'],
    label='Fitted Values',
    linestyle=':',
)
plt.legend()
plt.title('Time Series Forecast Result')
plt.xlabel('Date')
plt.ylabel('Value')
plt.show()
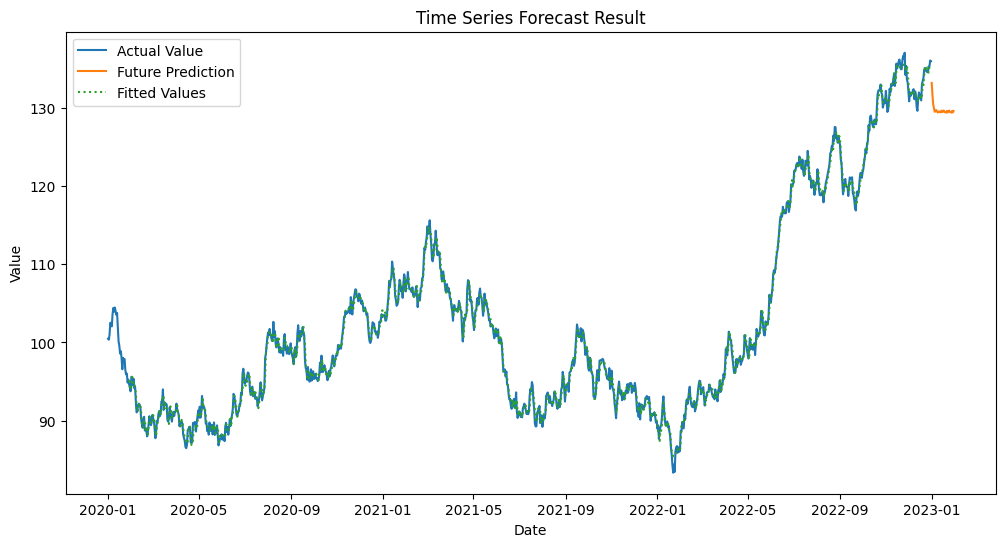
このコードで、実際の値と予測値を同じグラフ上にプロットします。
以下、実行結果です。

まとめ
mlforecastは、ビジネス意思決定に不可欠な時系列予測を効率的かつ効果的に行うための強力なPythonライブラリです。
使いやすいscikit-learnライクなAPIを提供しています。
このライブラリの特筆すべき点は、ARIMA、プロフェット、XGBoostなど、様々な予測モデルを簡単に実装できることです。
さらに、複数のモデルを組み合わせたアンサンブル学習により、予測精度を向上させることができます。
今回は、pipを使用した簡単なインストール方法から、データの準備、モデルの作成と学習、そして予測の実行まで、基本的な使用方法をお話ししました。
また、複数のモデルを同時に実装し、それぞれの予測結果を比較する高度な技法も紹介しました。
mlforecastは、その使いやすさと高性能な特徴により、時系列予測の初心者からエキスパートまで幅広いユーザーに適しています。
基本を押さえつつ、複数モデルの活用など高度な機能も駆使することで、より精度の高い予測が可能になります。
Python mlforecast で始める 機械学習 時系列予測 入門– 第2回:機械学習 時系列予測モデルとハイパーパラメータ調整 –

