
次の Python コードの出力はどれでしょうか?
Python コード:
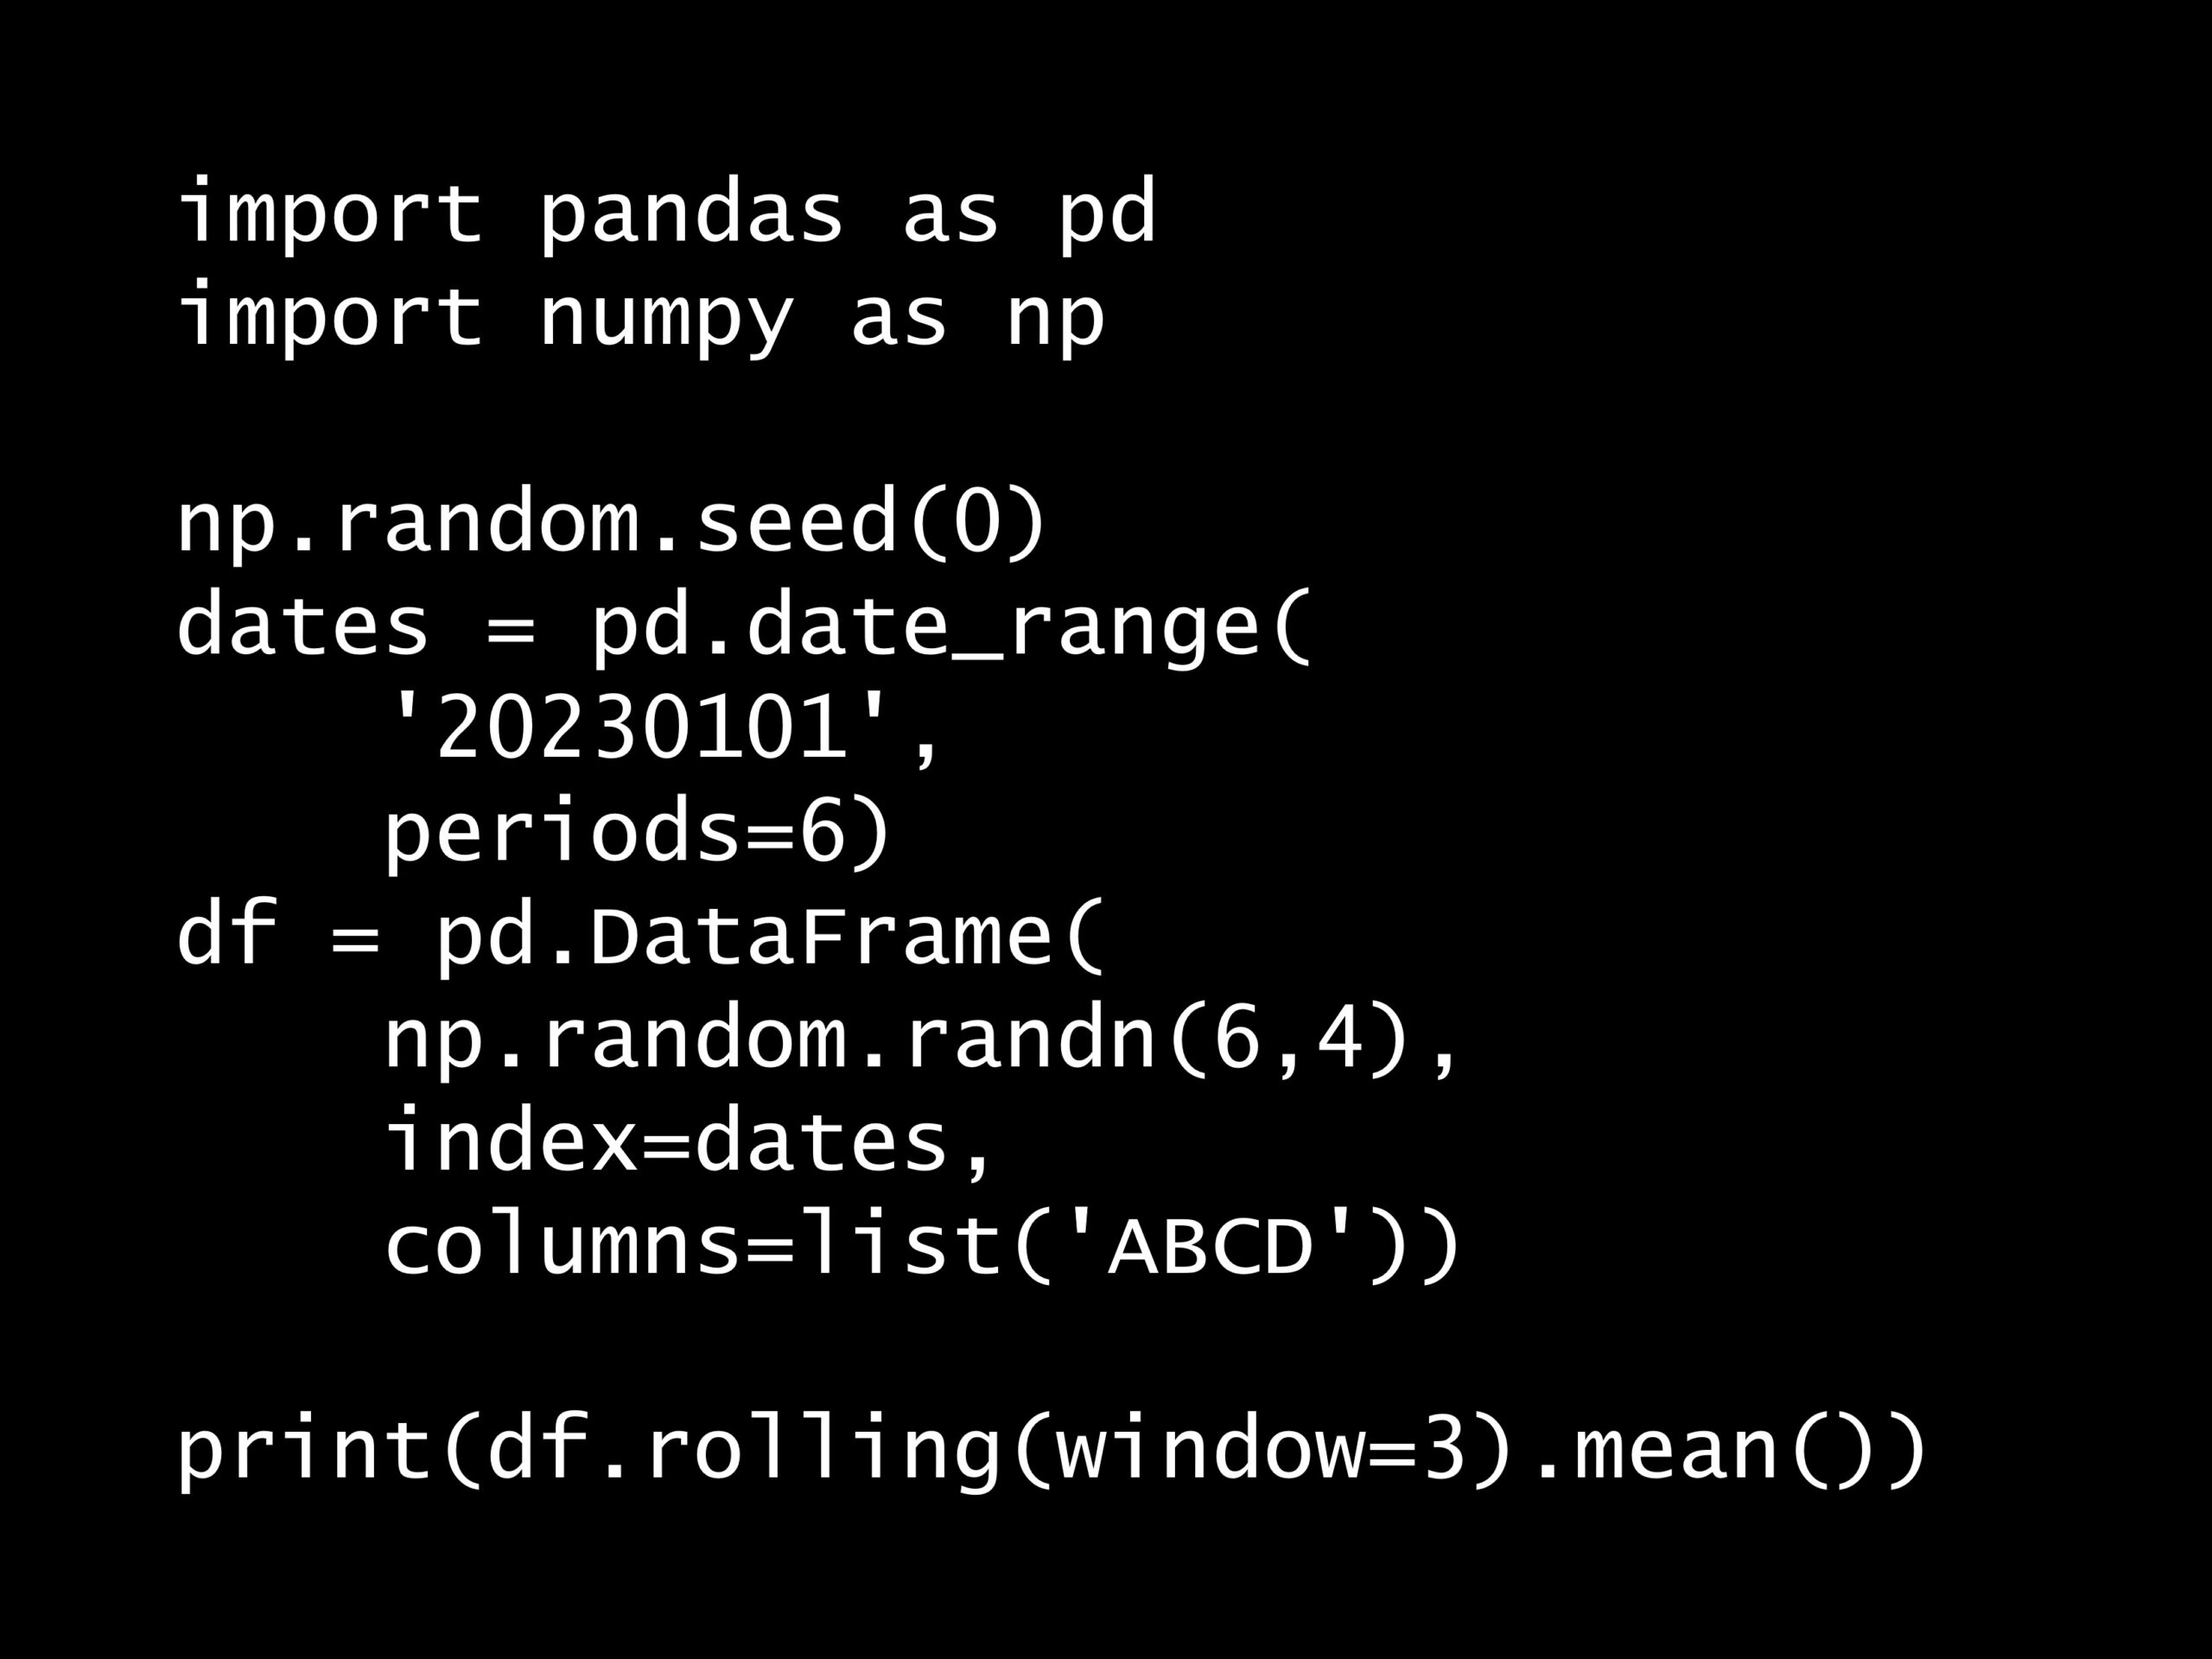
import pandas as pd
import numpy as np

np.random.seed(0)
dates = pd.date_range(
    '20230101',
    periods=6)

df = pd.DataFrame(
    np.random.randn(6,4),
    index=dates,
    columns=list('ABCD'))

print(df.rolling(window=3).mean())
import pandas as pd
import numpy as np
np.random.seed(0)
dates = pd.date_range(
'20230101',
periods=6)
df = pd.DataFrame(
np.random.randn(6,4),
index=dates,
columns=list('ABCD'))
print(df.rolling(window=3).mean())
import pandas as pd
import numpy as np
np.random.seed(0)
dates = pd.date_range(
'20230101',
periods=6)
df = pd.DataFrame(
np.random.randn(6,4),
index=dates,
columns=list('ABCD'))
print(df.rolling(window=3).mean())
回答の選択肢:
A. 各行の値が0に近いランダムな値
B. 最初の2行がNaN、残りがランダムな値
C. 全ての行がNaN
D. 最初の2行がNaN、残りが0に近い値
出力例:
                   A         B         C         D
2023-01-01       NaN       NaN       NaN       NaN
2023-01-02       NaN       NaN       NaN       NaN
2023-01-03  1.176130 -0.055507  0.690957  1.181270
2023-01-04  0.841792 -0.148335  0.512665  0.545530
2023-01-05  0.717299  0.109038  0.300325  0.311284
2023-01-06 -0.099291  0.190045  0.540456 -0.420862
A B C D
2023-01-01 NaN NaN NaN NaN
2023-01-02 NaN NaN NaN NaN
2023-01-03 1.176130 -0.055507 0.690957 1.181270
2023-01-04 0.841792 -0.148335 0.512665 0.545530
2023-01-05 0.717299 0.109038 0.300325 0.311284
2023-01-06 -0.099291 0.190045 0.540456 -0.420862
A B C D 2023-01-01 NaN NaN NaN NaN 2023-01-02 NaN NaN NaN NaN 2023-01-03 1.176130 -0.055507 0.690957 1.181270 2023-01-04 0.841792 -0.148335 0.512665 0.545530 2023-01-05 0.717299 0.109038 0.300325 0.311284 2023-01-06 -0.099291 0.190045 0.540456 -0.420862
正解:
B
解説:
rolling(window=3).mean() メソッドは、3つの観測値ごとに平均値を計算し、それぞれのウィンドウに対する移動平均を生成します。最初の2つのウィンドウは要素が3つに満たないため、結果は NaN となります。3番目のウィンドウからは、3つの値の平均が計算され、各列に対して移動平均が表示されます。生成された数値は標準正規分布からランダムに選ばれたため、平均が0に近い値となっています。
ちなみに、dfに格納されているデータは次のようになっています。データそのものはランダムに作っていますので、人によって数値は異なります。
                   A         B         C         D
2023-01-01  1.764052  0.400157  0.978738  2.240893
2023-01-02  1.867558 -0.977278  0.950088 -0.151357
2023-01-03 -0.103219  0.410599  0.144044  1.454274
2023-01-04  0.761038  0.121675  0.443863  0.333674
2023-01-05  1.494079 -0.205158  0.313068 -0.854096
2023-01-06 -2.552990  0.653619  0.864436 -0.742165
A B C D
2023-01-01 1.764052 0.400157 0.978738 2.240893
2023-01-02 1.867558 -0.977278 0.950088 -0.151357
2023-01-03 -0.103219 0.410599 0.144044 1.454274
2023-01-04 0.761038 0.121675 0.443863 0.333674
2023-01-05 1.494079 -0.205158 0.313068 -0.854096
2023-01-06 -2.552990 0.653619 0.864436 -0.742165
A B C D 2023-01-01 1.764052 0.400157 0.978738 2.240893 2023-01-02 1.867558 -0.977278 0.950088 -0.151357 2023-01-03 -0.103219 0.410599 0.144044 1.454274 2023-01-04 0.761038 0.121675 0.443863 0.333674 2023-01-05 1.494079 -0.205158 0.313068 -0.854096 2023-01-06 -2.552990 0.653619 0.864436 -0.742165