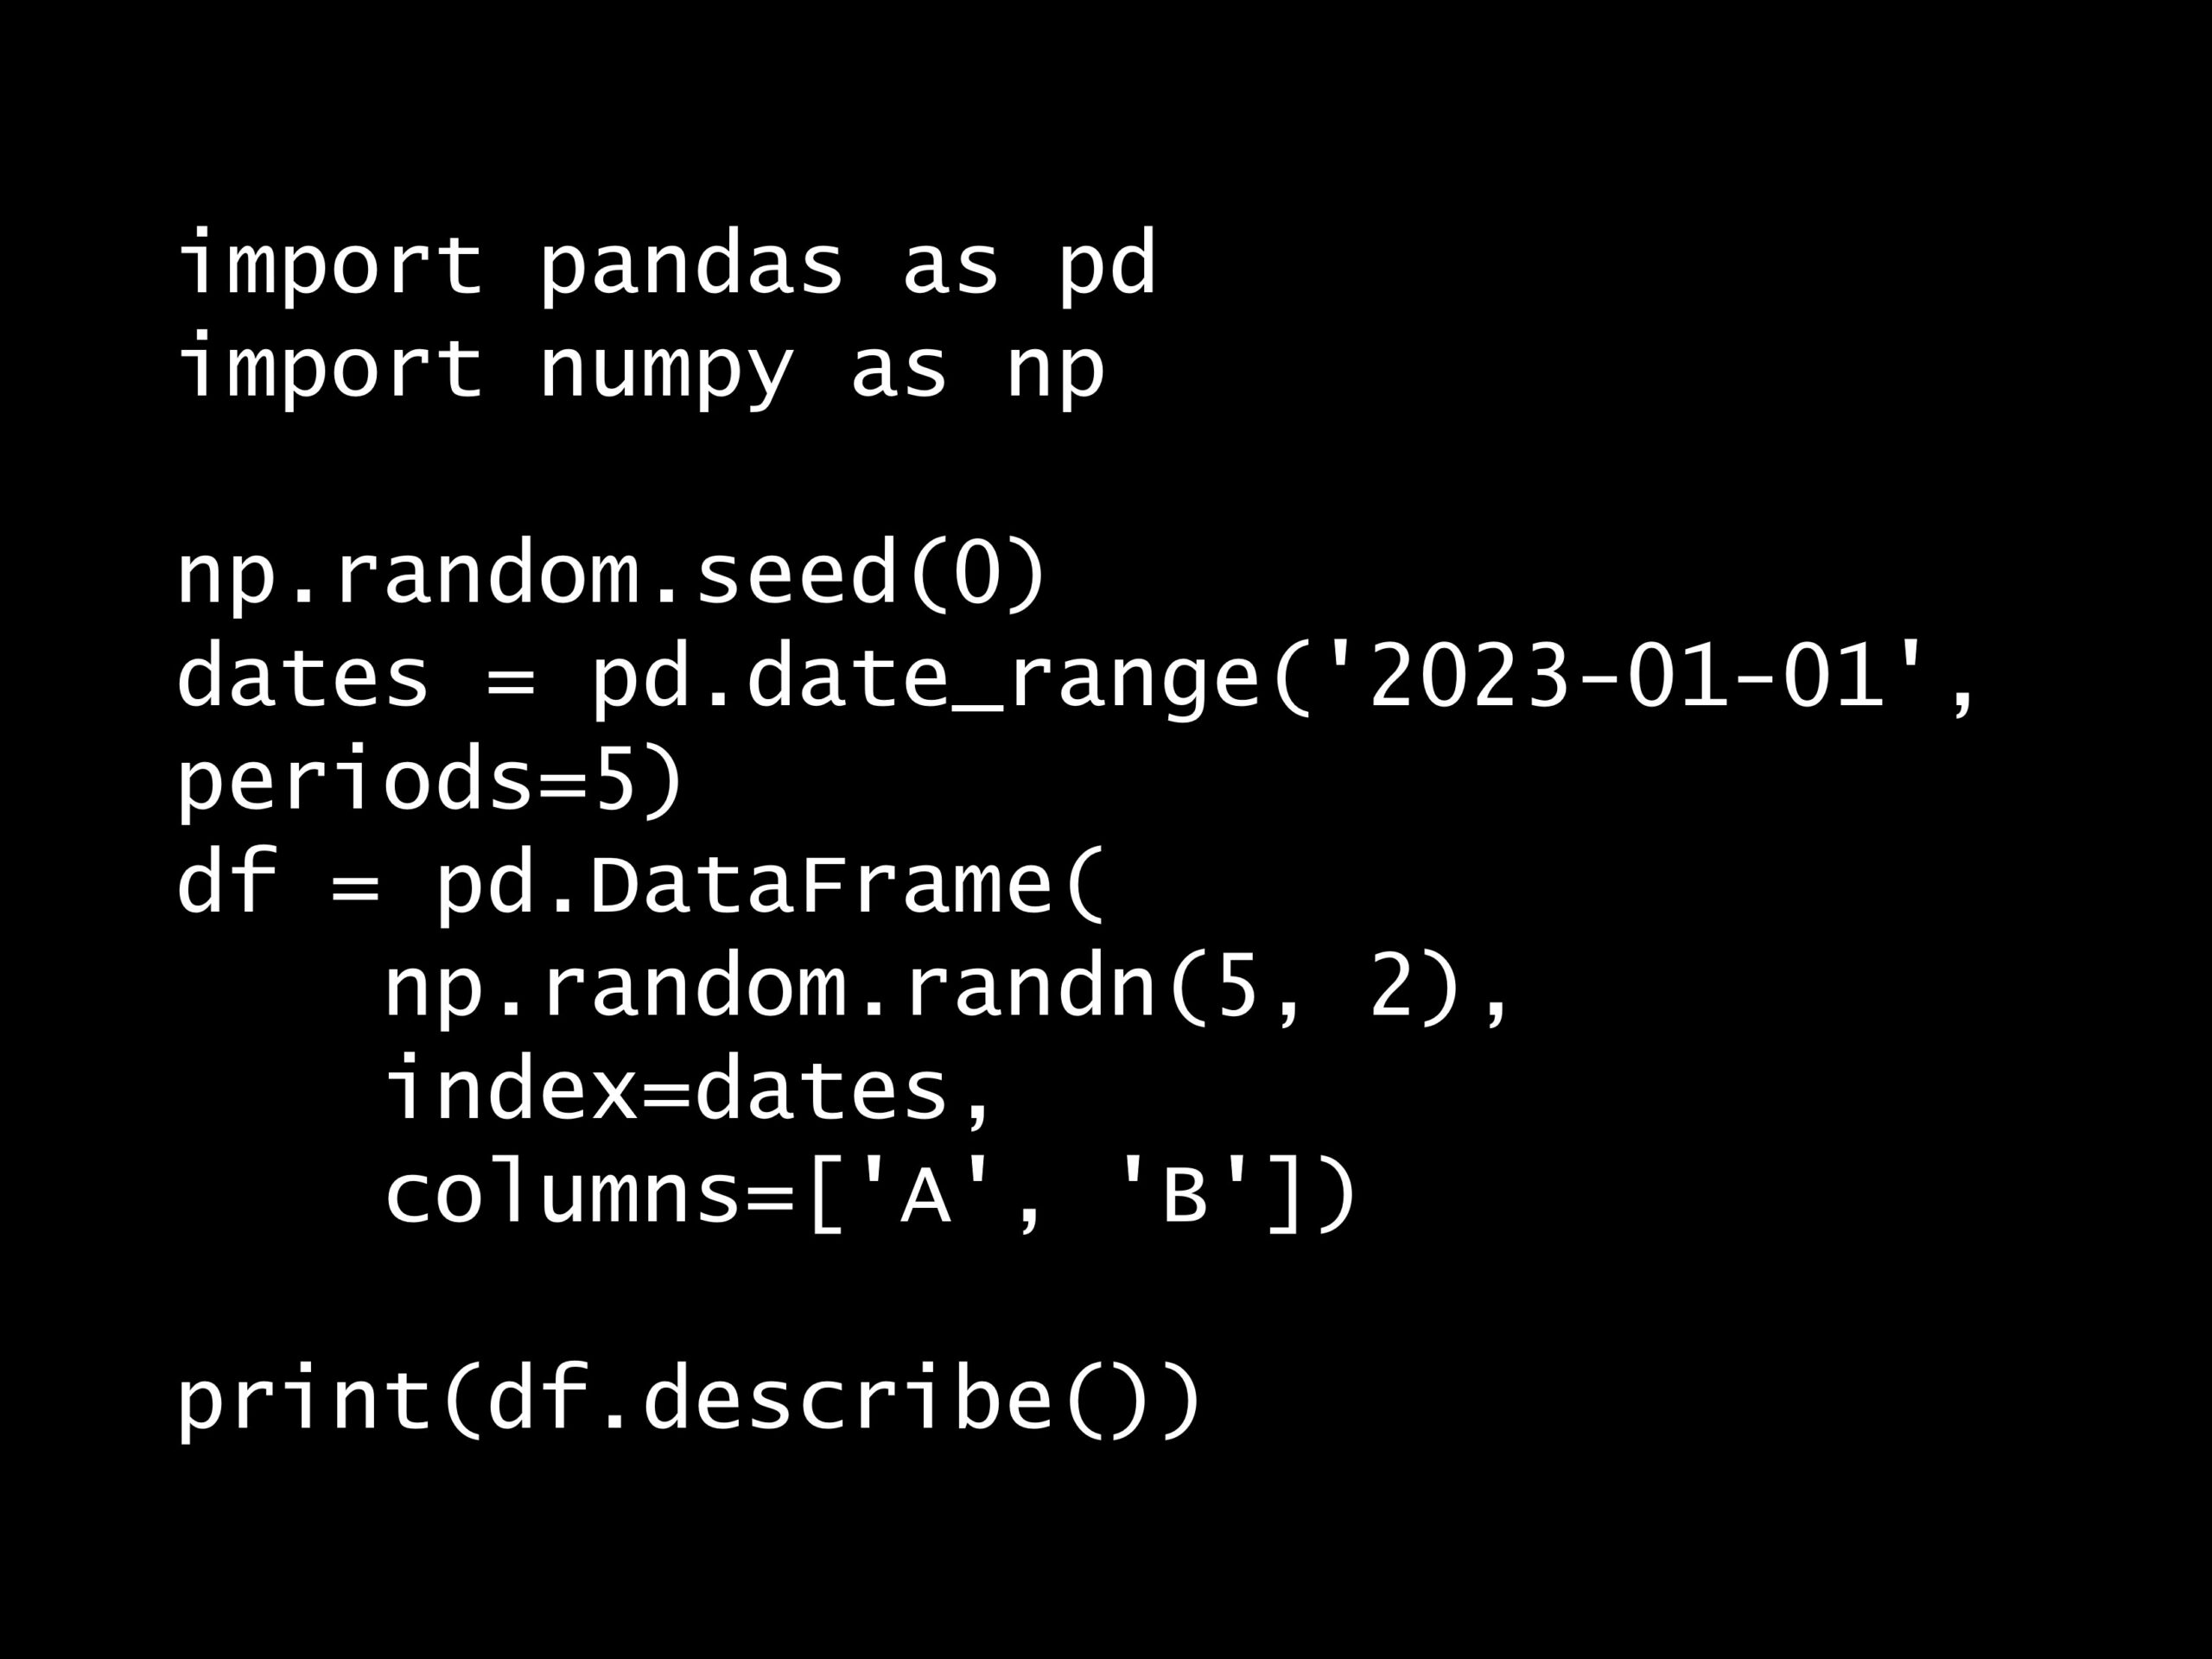
次の Python コードの出力はどれでしょうか?
Python コード:
import pandas as pd
import numpy as np

np.random.seed(0)
dates = pd.date_range('2023-01-01', periods=5)
df = pd.DataFrame(
    np.random.randn(5, 2),
    index=dates,
    columns=['A', 'B'])

print(df.describe())
import pandas as pd
import numpy as np
np.random.seed(0)
dates = pd.date_range('2023-01-01', periods=5)
df = pd.DataFrame(
np.random.randn(5, 2),
index=dates,
columns=['A', 'B'])
print(df.describe())
import pandas as pd
import numpy as np
np.random.seed(0)
dates = pd.date_range('2023-01-01', periods=5)
df = pd.DataFrame(
np.random.randn(5, 2),
index=dates,
columns=['A', 'B'])
print(df.describe())
回答の選択肢:
A. 各列の平均、標準偏差、最小値、最大値
B. 各列の合計、平均、中央値
C. 各列の平均、中央値、分位数
D. 各列のカウント、平均、標準偏差、最小値、25%、50%、75%、最大値
出力例:
              A         B
count  5.000000  5.000000
mean   1.091444  0.384603
std    0.792884  1.182022
min   -0.103219 -0.977278
25%    0.950088 -0.151357
50%    0.978738  0.400157
75%    1.764052  0.410599
max    1.867558  2.240893
A B
count 5.000000 5.000000
mean 1.091444 0.384603
std 0.792884 1.182022
min -0.103219 -0.977278
25% 0.950088 -0.151357
50% 0.978738 0.400157
75% 1.764052 0.410599
max 1.867558 2.240893
A B count 5.000000 5.000000 mean 1.091444 0.384603 std 0.792884 1.182022 min -0.103219 -0.977278 25% 0.950088 -0.151357 50% 0.978738 0.400157 75% 1.764052 0.410599 max 1.867558 2.240893
正解:
D
解説:
describe() 関数は、pandas DataFrame の各数値列についての統計量を計算し、表示します。これにはカウント、平均、標準偏差、最小値、各分位数(25%、50%、75%)、最大値が含まれます。
ちなみに、dfに格納されているデータは次のようになっています。
                   A         B
2023-01-01  1.764052  0.400157
2023-01-02  0.978738  2.240893
2023-01-03  1.867558 -0.977278
2023-01-04  0.950088 -0.151357
2023-01-05 -0.103219  0.410599
Freq: D, dtype: int64
A B
2023-01-01 1.764052 0.400157
2023-01-02 0.978738 2.240893
2023-01-03 1.867558 -0.977278
2023-01-04 0.950088 -0.151357
2023-01-05 -0.103219 0.410599
Freq: D, dtype: int64
A B 2023-01-01 1.764052 0.400157 2023-01-02 0.978738 2.240893 2023-01-03 1.867558 -0.977278 2023-01-04 0.950088 -0.151357 2023-01-05 -0.103219 0.410599 Freq: D, dtype: int64

