
次の Python コードの出力はどれでしょうか?
Python コード:
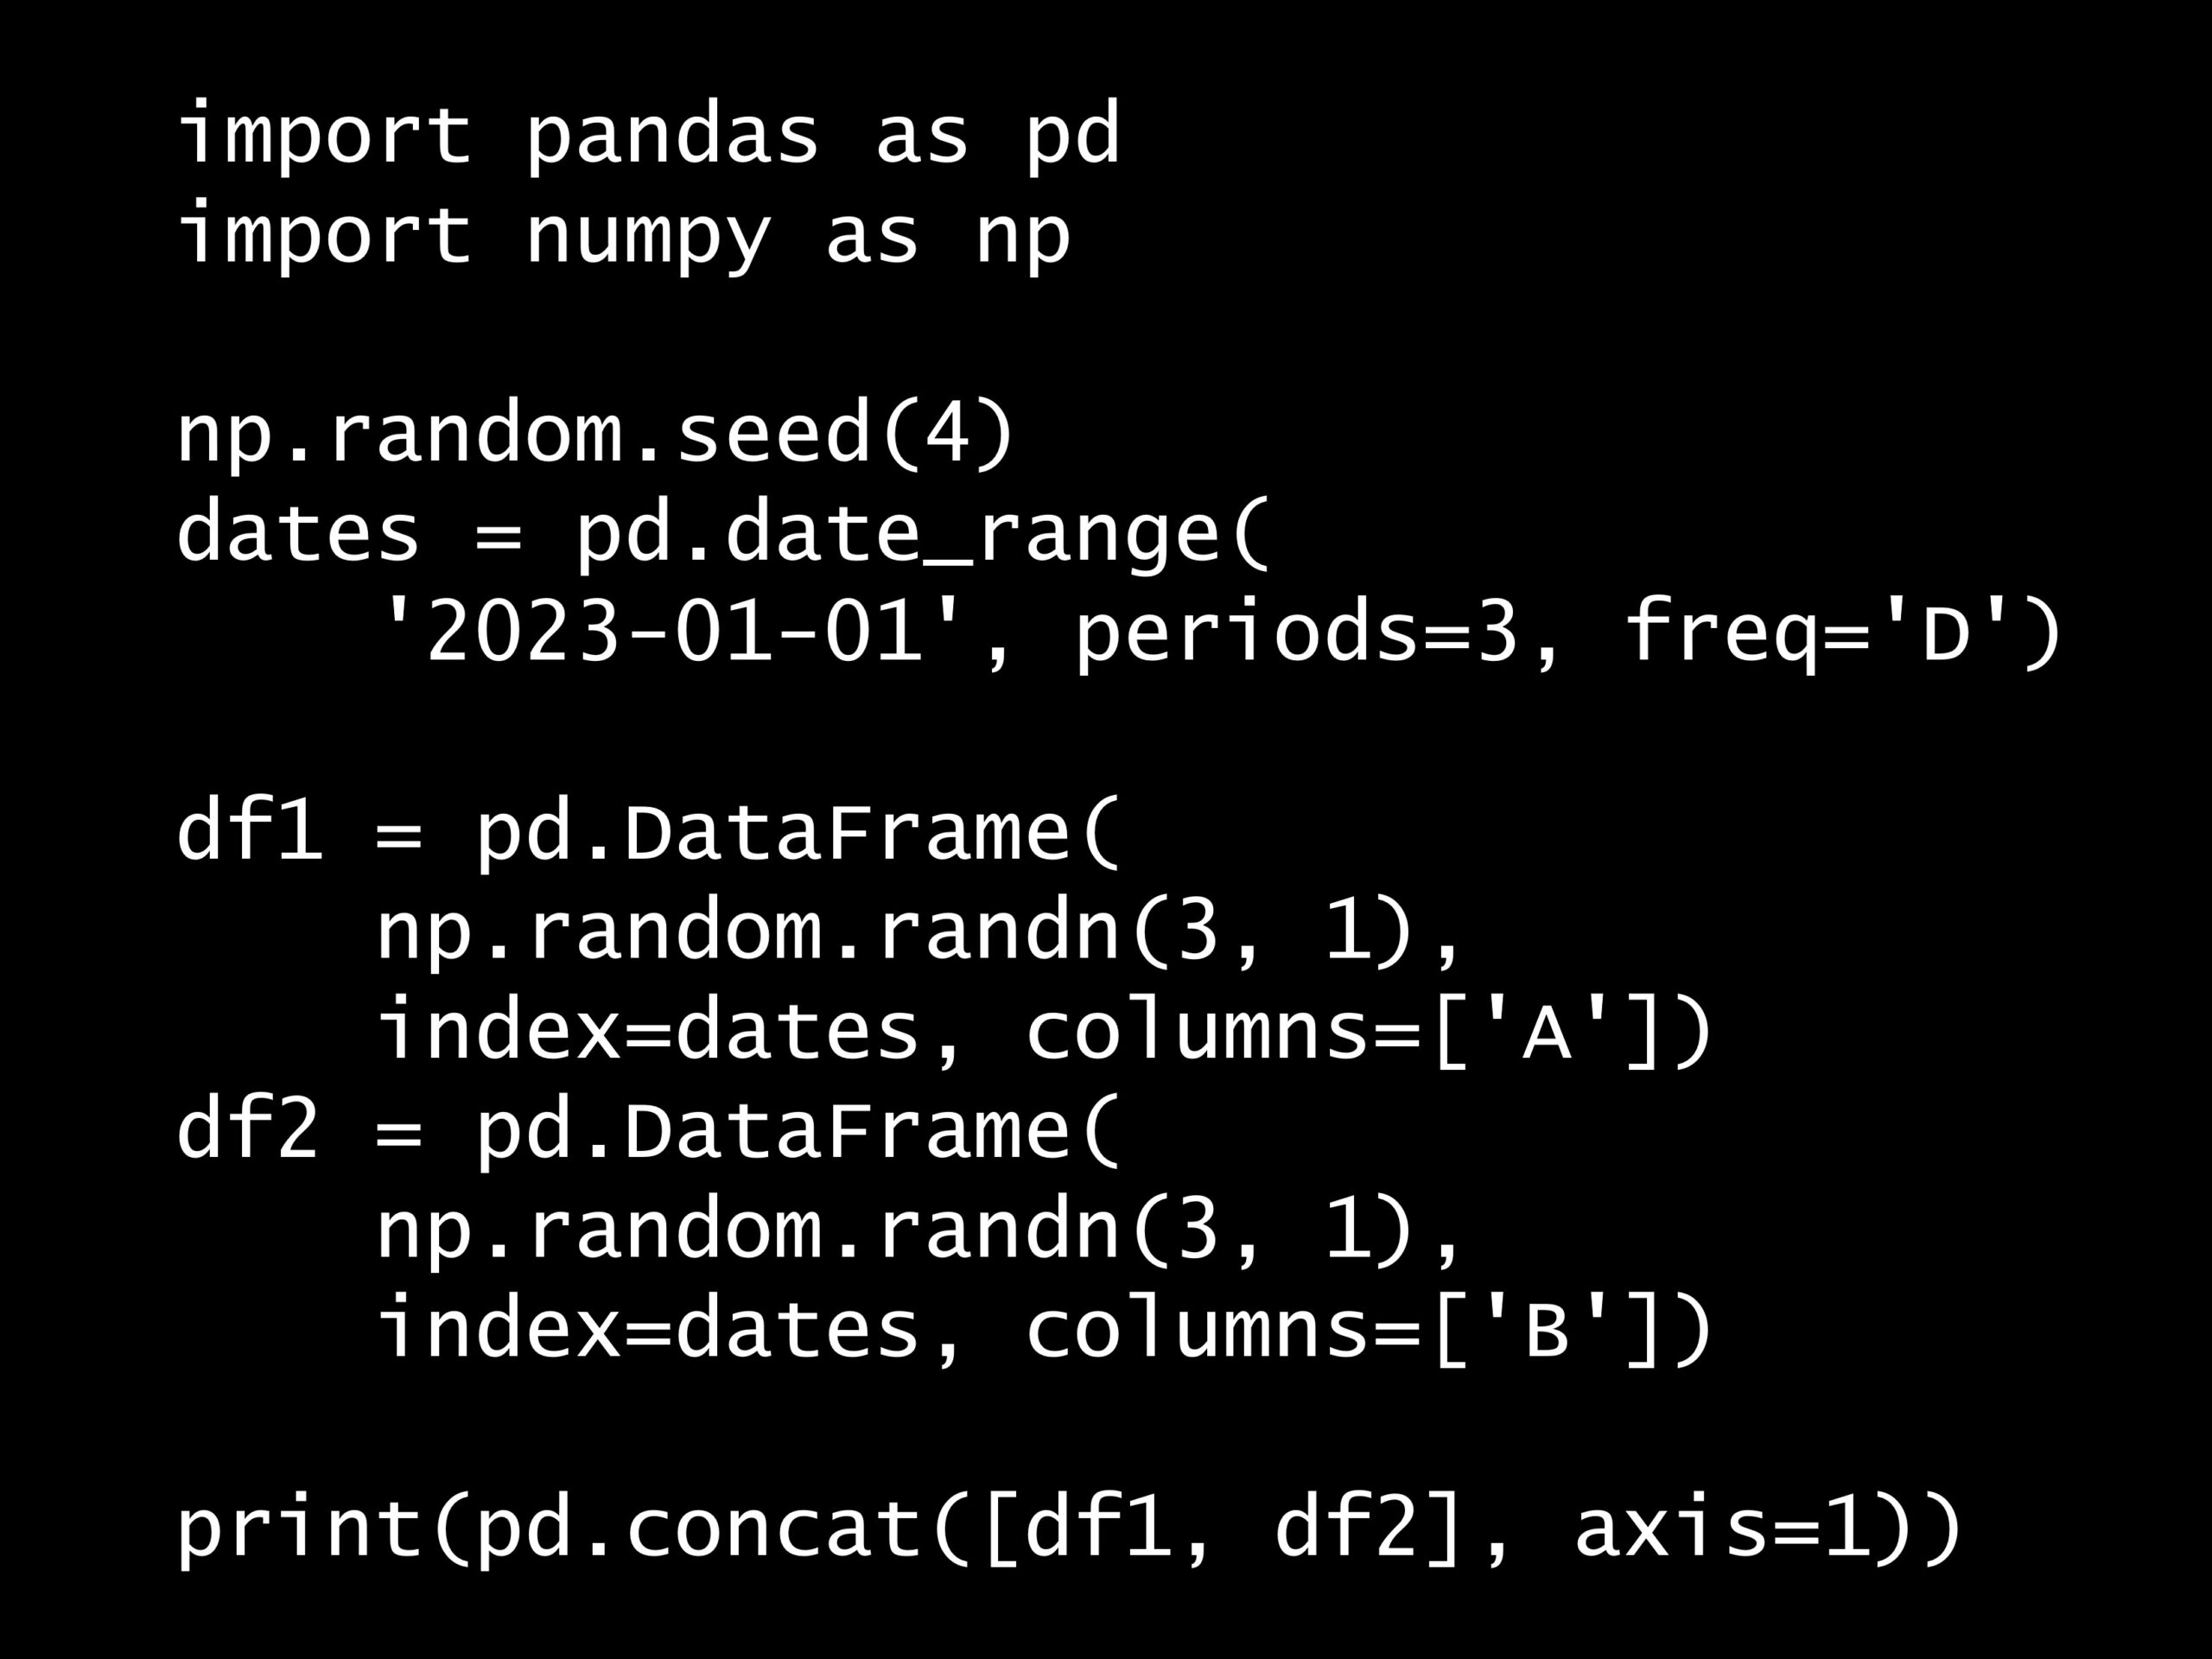
import pandas as pd
import numpy as np

np.random.seed(4)
dates = pd.date_range(
    '2023-01-01',
    periods=3,
    freq='D')

df1 = pd.DataFrame(
    np.random.randn(3, 1),
    index=dates,
    columns=['A'])
df2 = pd.DataFrame(
    np.random.randn(3, 1),
    index=dates,
    columns=['B'])

print(pd.concat([df1, df2], axis=1))
import pandas as pd
import numpy as np
np.random.seed(4)
dates = pd.date_range(
'2023-01-01',
periods=3,
freq='D')
df1 = pd.DataFrame(
np.random.randn(3, 1),
index=dates,
columns=['A'])
df2 = pd.DataFrame(
np.random.randn(3, 1),
index=dates,
columns=['B'])
print(pd.concat([df1, df2], axis=1))
import pandas as pd
import numpy as np
np.random.seed(4)
dates = pd.date_range(
'2023-01-01',
periods=3,
freq='D')
df1 = pd.DataFrame(
np.random.randn(3, 1),
index=dates,
columns=['A'])
df2 = pd.DataFrame(
np.random.randn(3, 1),
index=dates,
columns=['B'])
print(pd.concat([df1, df2], axis=1))
回答の選択肢:
(A) 2つの異なる列AとBを持つデータフレーム
(B) 2つのデータフレームが縦に結合されたもの
(C) 重複するインデックスを持つデータフレーム
(D) 2つのデータフレームが横に結合されたもの、ただし列は重複
出力例:
                   A         B
2023-01-01  0.050562  0.693599
2023-01-02  0.499951 -0.418302
2023-01-03 -0.995909 -1.584577
A B
2023-01-01 0.050562 0.693599
2023-01-02 0.499951 -0.418302
2023-01-03 -0.995909 -1.584577
A B 2023-01-01 0.050562 0.693599 2023-01-02 0.499951 -0.418302 2023-01-03 -0.995909 -1.584577
正解:
(A)
解説:
例えば、df1に格納されているデータは次のようになっています。ランダムな値を入れているため、人によって値は異なります。
                   A
2023-01-01  0.050562
2023-01-02  0.499951
2023-01-03 -0.995909
A
2023-01-01 0.050562
2023-01-02 0.499951
2023-01-03 -0.995909
A 2023-01-01 0.050562 2023-01-02 0.499951 2023-01-03 -0.995909
df2に格納されているデータは次のようになっています。ランダムな値を入れているため、人によって値は異なります。
                   B
2023-01-01  0.693599
2023-01-02 -0.418302
2023-01-03 -1.584577
B
2023-01-01 0.693599
2023-01-02 -0.418302
2023-01-03 -1.584577
B 2023-01-01 0.693599 2023-01-02 -0.418302 2023-01-03 -1.584577
pd.concat([df1, df2], axis=1) は、2つのデータフレーム df1 と df2 を横方向に結合します。axis=1 パラメータはデータフレームを横に結合することを意味します。
結果として、生成されたデータフレームには、両方のデータフレームの列(この場合は A と B)が含まれ、同じインデックスに基づいて並んでいます。この方法は、異なる特徴を持つ時系列データを統合する際によく使用されます。