
次の Python コードの出力はどれでしょうか?
Python コード:
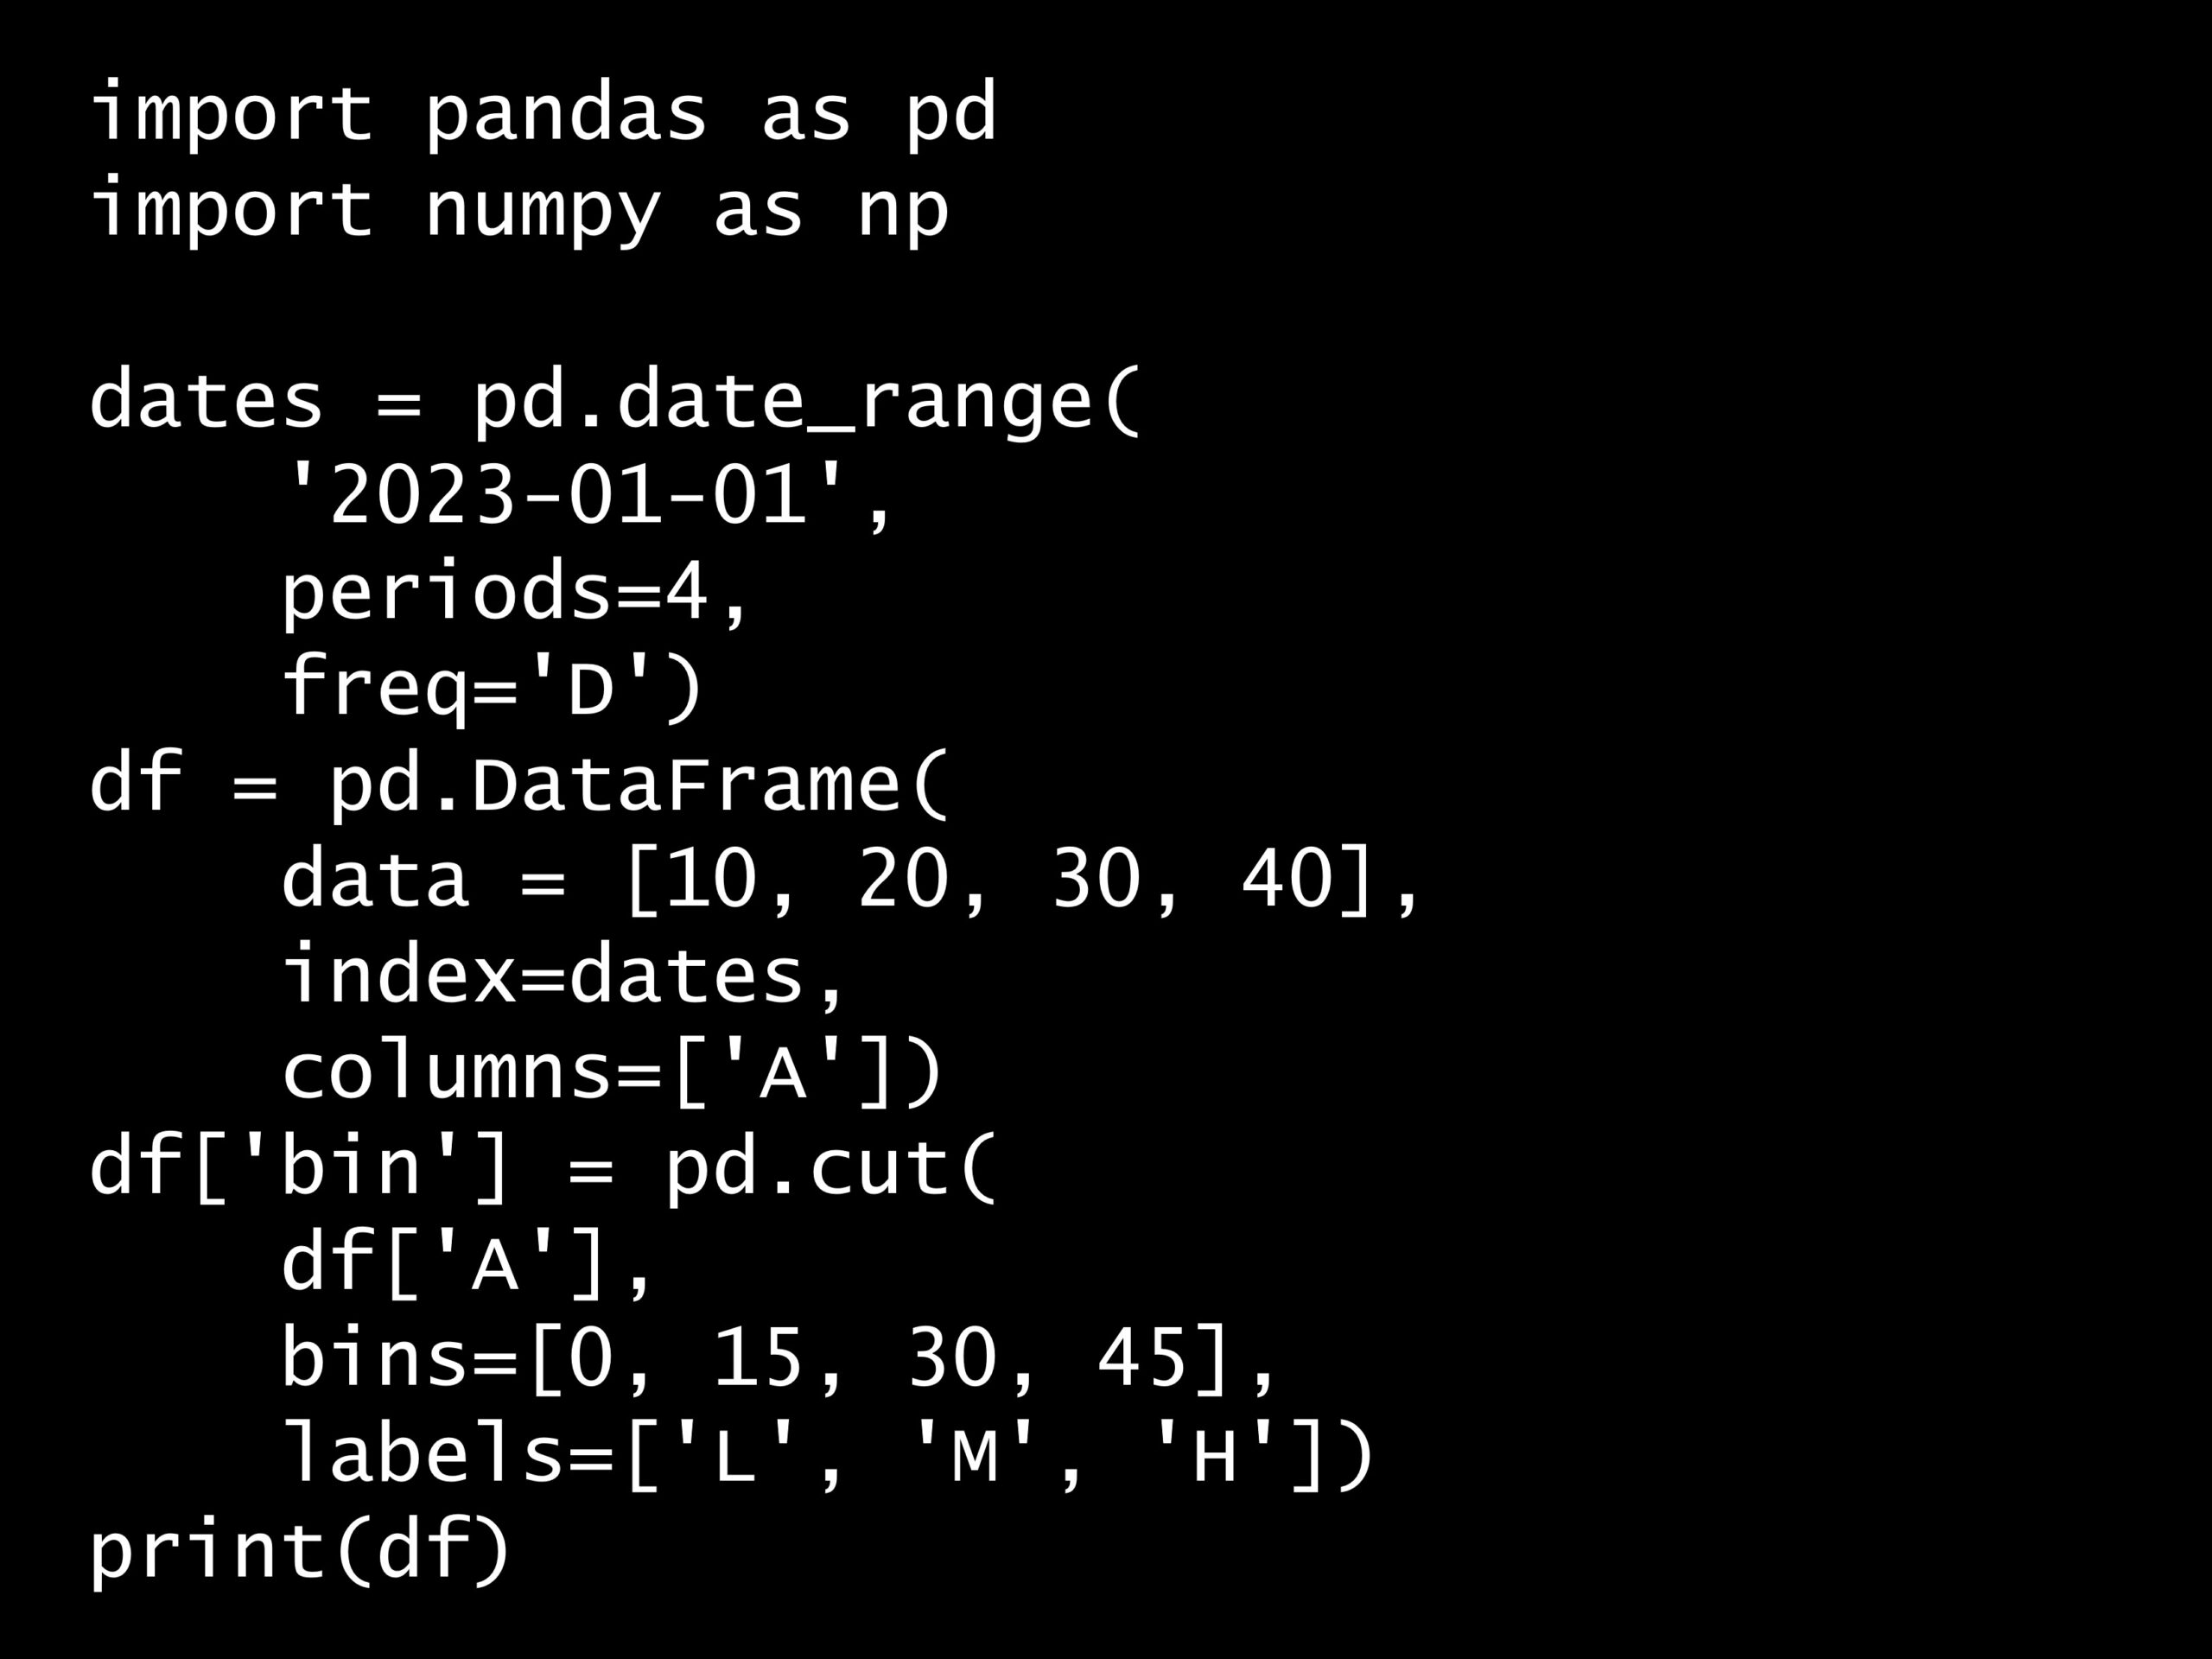
import pandas as pd
import numpy as np

dates = pd.date_range(
    '2023-01-01',
    periods=4,
    freq='D')
df = pd.DataFrame(
    data = [10, 20, 30, 40],
    index=dates,
    columns=['A'])
df['bin'] = pd.cut(
    df['A'],
    bins=[0, 15, 30, 45],
    labels=['L', 'M', 'H'])
print(df)
import pandas as pd
import numpy as np
dates = pd.date_range(
'2023-01-01',
periods=4,
freq='D')
df = pd.DataFrame(
data = [10, 20, 30, 40],
index=dates,
columns=['A'])
df['bin'] = pd.cut(
df['A'],
bins=[0, 15, 30, 45],
labels=['L', 'M', 'H'])
print(df)
import pandas as pd
import numpy as np
dates = pd.date_range(
'2023-01-01',
periods=4,
freq='D')
df = pd.DataFrame(
data = [10, 20, 30, 40],
index=dates,
columns=['A'])
df['bin'] = pd.cut(
df['A'],
bins=[0, 15, 30, 45],
labels=['L', 'M', 'H'])
print(df)
回答の選択肢:
(A) bin列の値:上から L, M, M, H
(B) bin列の値:ランダムな値
(C) bin列の値:上から L, M, H, H
(D) bin列の値:A例と同じ値
出力例:
             A bin
2023-01-01  10   L
2023-01-02  20   M
2023-01-03  30   M
2023-01-04  40   H
A bin
2023-01-01 10 L
2023-01-02 20 M
2023-01-03 30 M
2023-01-04 40 H
A bin 2023-01-01 10 L 2023-01-02 20 M 2023-01-03 30 M 2023-01-04 40 H
正解:
(A)
解説:
このコードは、数値型の特徴量を取り扱い、それを指定した範囲(ビン)ごとにカテゴリ変数に変換しています。
詳しく説明します。
‘2023-01-01’から始まる日単位の日付範囲を4期間作ります。
dates = pd.date_range(
    '2023-01-01',
    periods=4,
    freq='D')
dates = pd.date_range(
'2023-01-01',
periods=4,
freq='D')
dates = pd.date_range(
'2023-01-01',
periods=4,
freq='D')
datesに格納されているデータは次のようになっています。
DatetimeIndex(['2023-01-01', '2023-01-02', '2023-01-03', '2023-01-04'], dtype='datetime64[ns]', freq='D')
DatetimeIndex(['2023-01-01', '2023-01-02', '2023-01-03', '2023-01-04'], dtype='datetime64[ns]', freq='D')
DatetimeIndex(['2023-01-01', '2023-01-02', '2023-01-03', '2023-01-04'], dtype='datetime64[ns]', freq='D')
そして、この日付インデックスをもとに、10、20、30、40という値のデータフレームを作ります。
df = pd.DataFrame(
    data = [10, 20, 30, 40],
    index=dates,
    columns=['A'])
df = pd.DataFrame(
data = [10, 20, 30, 40],
index=dates,
columns=['A'])
df = pd.DataFrame(
data = [10, 20, 30, 40],
index=dates,
columns=['A'])
dfに格納されているデータは次のようになっています。
             A
2023-01-01  10
2023-01-02  20
2023-01-03  30
2023-01-04  40
A
2023-01-01 10
2023-01-02 20
2023-01-03 30
2023-01-04 40
A 2023-01-01 10 2023-01-02 20 2023-01-03 30 2023-01-04 40
`pd.cut`関数を用いて数値を特定の範囲(ビン)に変換し、それぞれを指定したラベル(’L’、’M’、’H’)に変換します。
df['bin'] = pd.cut(
    df['A'],
    bins=[0, 15, 30, 45],
    labels=['L', 'M', 'H'])
df['bin'] = pd.cut(
df['A'],
bins=[0, 15, 30, 45],
labels=['L', 'M', 'H'])
df['bin'] = pd.cut(
df['A'],
bins=[0, 15, 30, 45],
labels=['L', 'M', 'H'])
具体的には、0から15までは’L’、15以上30以下は’M’、30以上45以下は’H’とします。こうすることで、連続的な数値データをカテゴリデータに変換することができます。
新たなデータフレームを出力して元の値とそれに対応するカテゴリを表示します。
print(df)
print(df)
print(df)
             A bin
2023-01-01  10   L
2023-01-02  20   M
2023-01-03  30   M
2023-01-04  40   H
A bin
2023-01-01 10 L
2023-01-02 20 M
2023-01-03 30 M
2023-01-04 40 H
A bin 2023-01-01 10 L 2023-01-02 20 M 2023-01-03 30 M 2023-01-04 40 H
ビニングはデータをビジュアル化しやすくするため、または連続的な数値データを扱うのが難しい特定の機械学習アルゴリズムにデータを適合させるために使用されます。