
次の Python コードの出力はどれでしょうか?
Python コード:
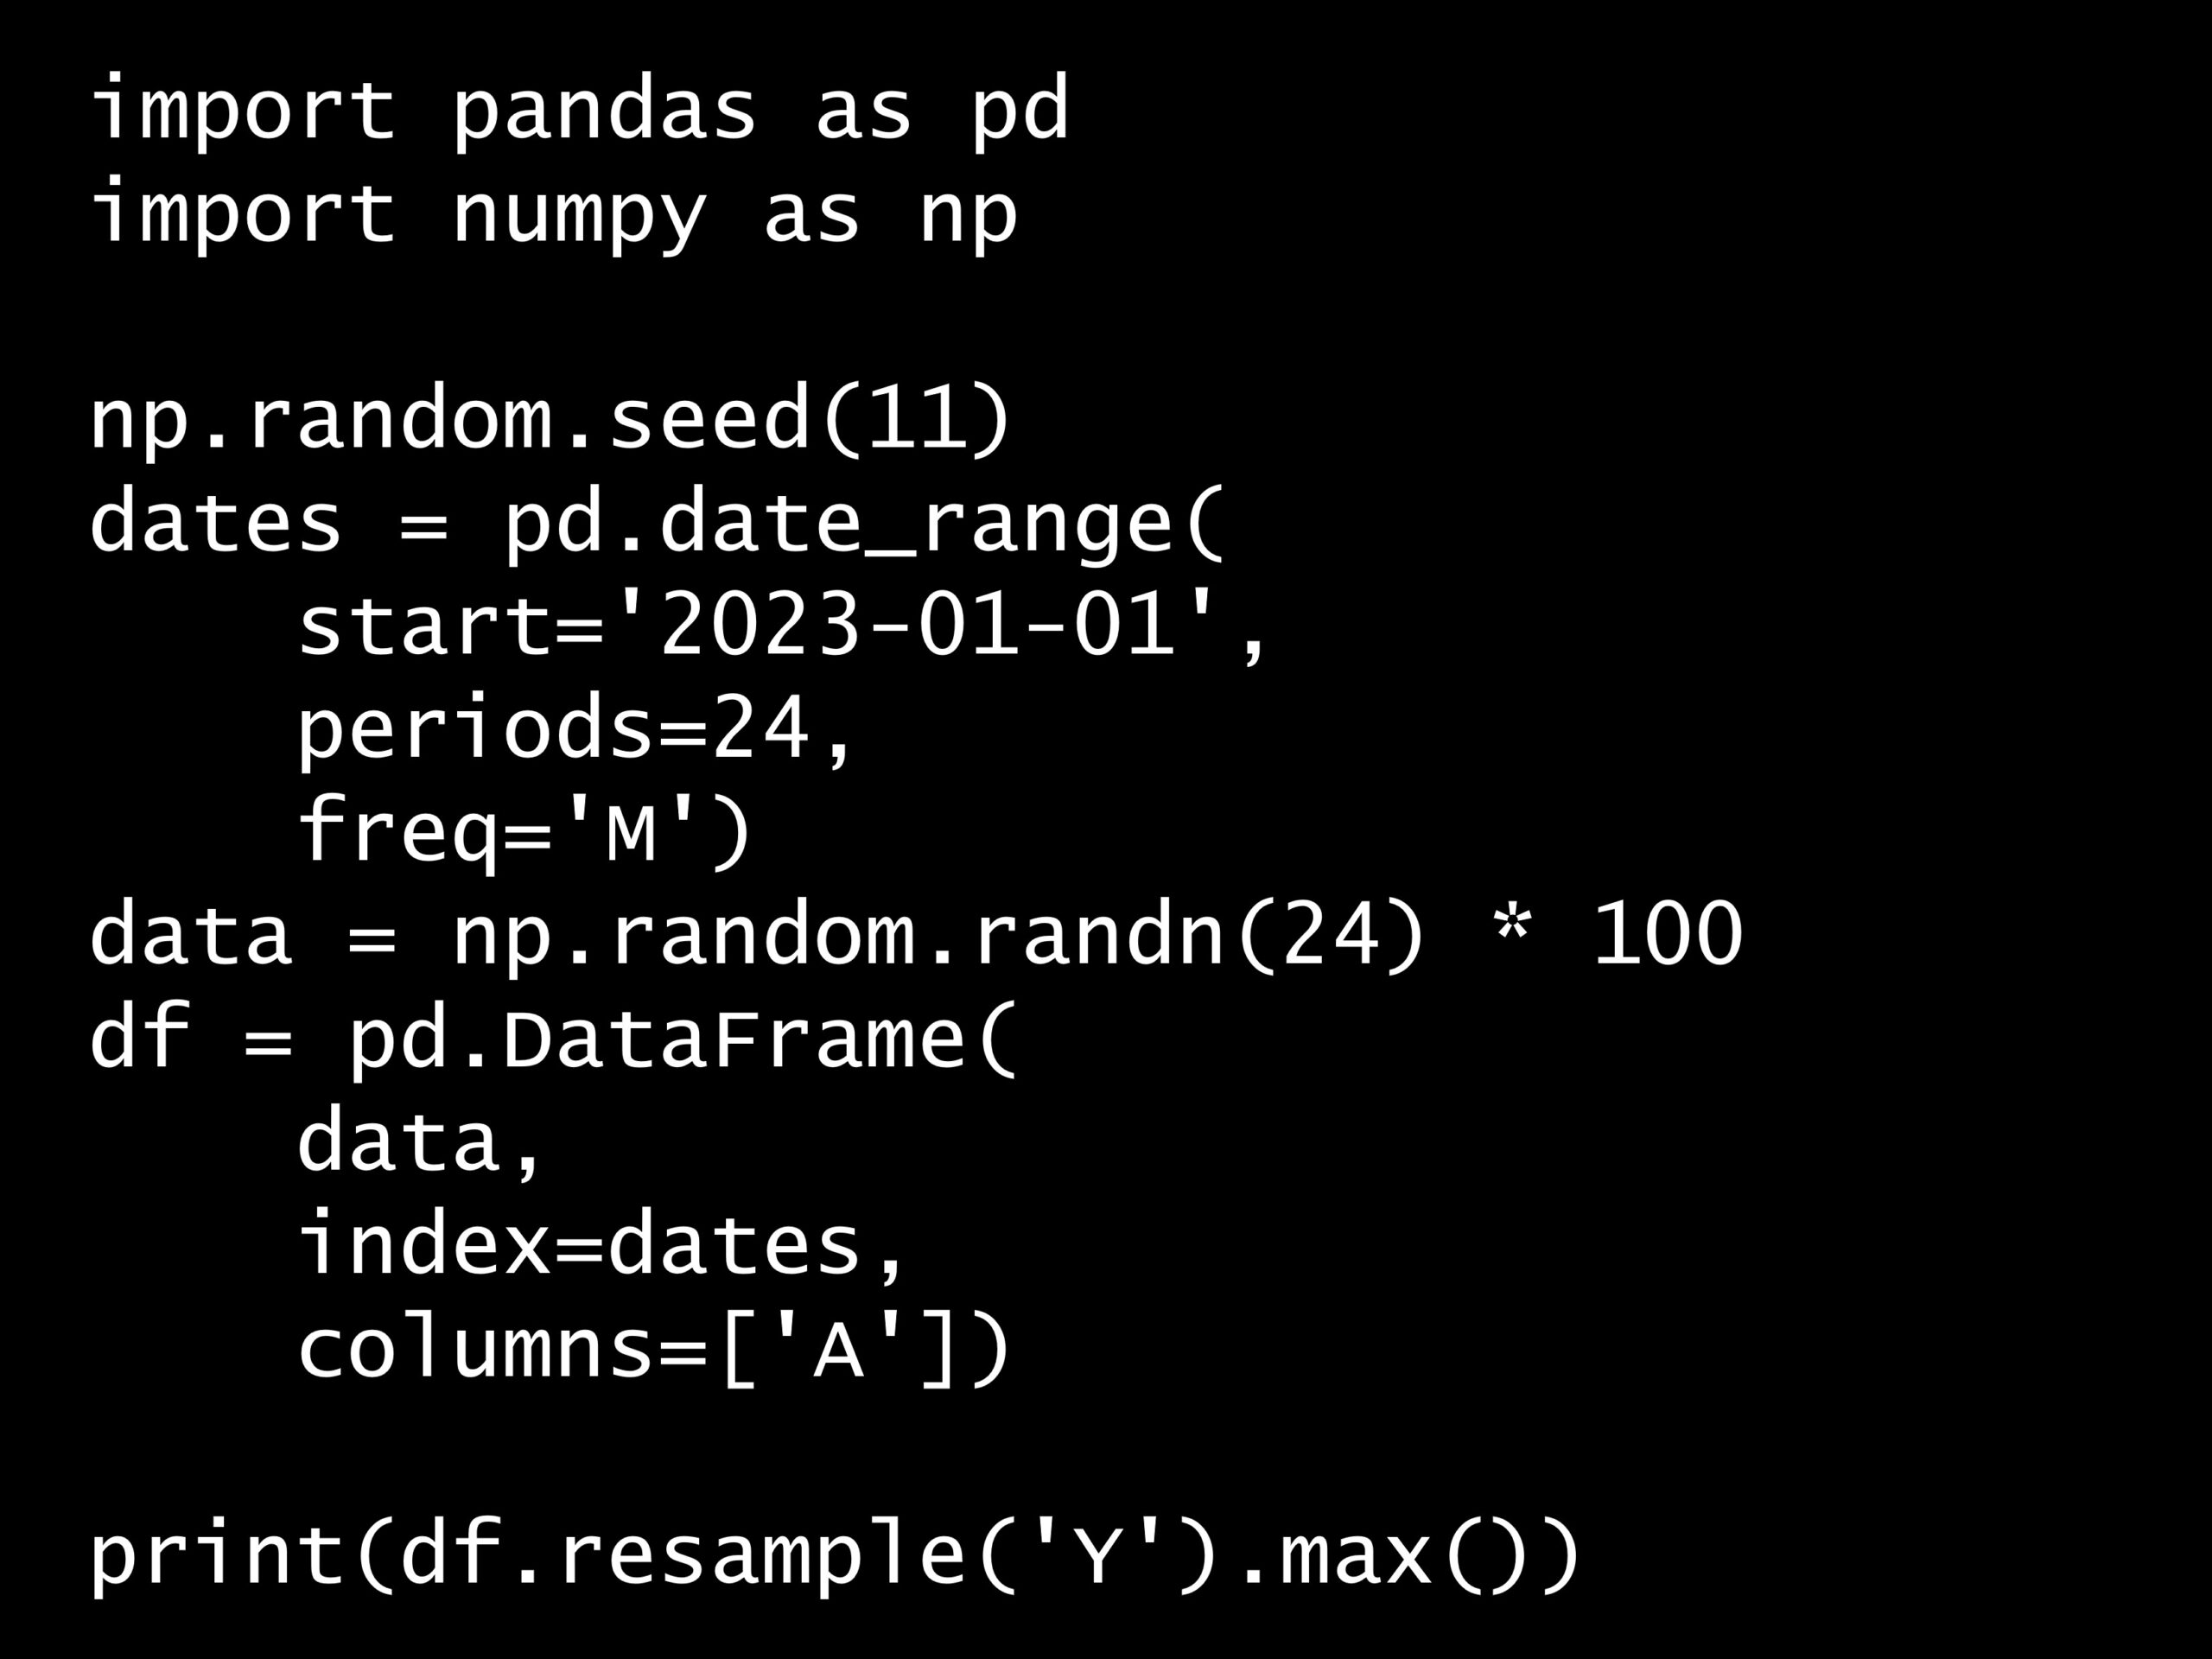
import pandas as pd
import numpy as np

np.random.seed(11)
dates = pd.date_range(
    start='2023-01-01',
    periods=24,
    freq='M')
data = np.random.randn(24) * 100
df = pd.DataFrame(
    data,
    index=dates,
    columns=['A'])

print(df.resample('Y').max())
import pandas as pd
import numpy as np
np.random.seed(11)
dates = pd.date_range(
start='2023-01-01',
periods=24,
freq='M')
data = np.random.randn(24) * 100
df = pd.DataFrame(
data,
index=dates,
columns=['A'])
print(df.resample('Y').max())
import pandas as pd
import numpy as np
np.random.seed(11)
dates = pd.date_range(
start='2023-01-01',
periods=24,
freq='M')
data = np.random.randn(24) * 100
df = pd.DataFrame(
data,
index=dates,
columns=['A'])
print(df.resample('Y').max())
回答の選択肢:
(A) 各月のランダムな最大値
(B) 先月からの最大変化量
(C) 各年の最大値
(D) 前年からの最大変化量
出力例:
                     A
2023-12-31  174.945474
2024-12-31  157.463407
A
2023-12-31 174.945474
2024-12-31 157.463407
A 2023-12-31 174.945474 2024-12-31 157.463407
正解:
(C)
解説:
このコードは、ランダムに生成された数値の時系列データを作り、それに対して年間最大値を求めています。
詳しく説明します。
‘2023-01-01’から始まる月単位の日付範囲を24期間作っています。
dates = pd.date_range(
    start='2023-01-01',
    periods=24,
    freq='M')
dates = pd.date_range(
start='2023-01-01',
periods=24,
freq='M')
dates = pd.date_range(
start='2023-01-01',
periods=24,
freq='M')
datesに格納されているデータは次のようになっています。
DatetimeIndex(['2023-01-31', '2023-02-28', '2023-03-31', '2023-04-30',
               '2023-05-31', '2023-06-30', '2023-07-31', '2023-08-31',
               '2023-09-30', '2023-10-31', '2023-11-30', '2023-12-31',
               '2024-01-31', '2024-02-29', '2024-03-31', '2024-04-30',
               '2024-05-31', '2024-06-30', '2024-07-31', '2024-08-31',
               '2024-09-30', '2024-10-31', '2024-11-30', '2024-12-31'],
              dtype='datetime64[ns]', freq='M')
DatetimeIndex(['2023-01-31', '2023-02-28', '2023-03-31', '2023-04-30',
'2023-05-31', '2023-06-30', '2023-07-31', '2023-08-31',
'2023-09-30', '2023-10-31', '2023-11-30', '2023-12-31',
'2024-01-31', '2024-02-29', '2024-03-31', '2024-04-30',
'2024-05-31', '2024-06-30', '2024-07-31', '2024-08-31',
'2024-09-30', '2024-10-31', '2024-11-30', '2024-12-31'],
dtype='datetime64[ns]', freq='M')
標準正規分布からランダムな数値を24個生成し、それぞれに100を掛けることで、一定の範囲のランダムな数値を生成しています。
data = np.random.randn(24) * 100
data = np.random.randn(24) * 100
data = np.random.randn(24) * 100
dataに格納されているデータは次のようになっています。
[ 174.94547413  -28.60729968  -48.45651322 -265.33185593   -0.82846294
  -31.96313638  -53.66293622   31.54026684   42.10507163 -106.56029804
  -88.623967    -47.57334927   68.96823102   56.1192176  -130.55485098
 -111.94752616   73.68373912  157.46340731   -3.10750885  -68.34466275
  109.56296985  -30.95766372   72.57522248  154.90716334]
[ 174.94547413 -28.60729968 -48.45651322 -265.33185593 -0.82846294
-31.96313638 -53.66293622 31.54026684 42.10507163 -106.56029804
-88.623967 -47.57334927 68.96823102 56.1192176 -130.55485098
-111.94752616 73.68373912 157.46340731 -3.10750885 -68.34466275
109.56296985 -30.95766372 72.57522248 154.90716334]
[ 174.94547413 -28.60729968 -48.45651322 -265.33185593 -0.82846294 -31.96313638 -53.66293622 31.54026684 42.10507163 -106.56029804 -88.623967 -47.57334927 68.96823102 56.1192176 -130.55485098 -111.94752616 73.68373912 157.46340731 -3.10750885 -68.34466275 109.56296985 -30.95766372 72.57522248 154.90716334]
生成したデータと日付範囲を用いてデータフレームを作成します。データフレームの列名は ‘A’ とされています。
df = pd.DataFrame(
    data,
    index=dates,
    columns=['A'])
df = pd.DataFrame(
data,
index=dates,
columns=['A'])
df = pd.DataFrame(
data,
index=dates,
columns=['A'])
dfに格納されているデータは次のようになっています。
                     A
2023-01-31  174.945474
2023-02-28  -28.607300
2023-03-31  -48.456513
2023-04-30 -265.331856
2023-05-31   -0.828463
2023-06-30  -31.963136
2023-07-31  -53.662936
2023-08-31   31.540267
2023-09-30   42.105072
2023-10-31 -106.560298
2023-11-30  -88.623967
2023-12-31  -47.573349
2024-01-31   68.968231
2024-02-29   56.119218
2024-03-31 -130.554851
2024-04-30 -111.947526
2024-05-31   73.683739
2024-06-30  157.463407
2024-07-31   -3.107509
2024-08-31  -68.344663
2024-09-30  109.562970
2024-10-31  -30.957664
2024-11-30   72.575222
2024-12-31  154.907163
A
2023-01-31 174.945474
2023-02-28 -28.607300
2023-03-31 -48.456513
2023-04-30 -265.331856
2023-05-31 -0.828463
2023-06-30 -31.963136
2023-07-31 -53.662936
2023-08-31 31.540267
2023-09-30 42.105072
2023-10-31 -106.560298
2023-11-30 -88.623967
2023-12-31 -47.573349
2024-01-31 68.968231
2024-02-29 56.119218
2024-03-31 -130.554851
2024-04-30 -111.947526
2024-05-31 73.683739
2024-06-30 157.463407
2024-07-31 -3.107509
2024-08-31 -68.344663
2024-09-30 109.562970
2024-10-31 -30.957664
2024-11-30 72.575222
2024-12-31 154.907163
A 2023-01-31 174.945474 2023-02-28 -28.607300 2023-03-31 -48.456513 2023-04-30 -265.331856 2023-05-31 -0.828463 2023-06-30 -31.963136 2023-07-31 -53.662936 2023-08-31 31.540267 2023-09-30 42.105072 2023-10-31 -106.560298 2023-11-30 -88.623967 2023-12-31 -47.573349 2024-01-31 68.968231 2024-02-29 56.119218 2024-03-31 -130.554851 2024-04-30 -111.947526 2024-05-31 73.683739 2024-06-30 157.463407 2024-07-31 -3.107509 2024-08-31 -68.344663 2024-09-30 109.562970 2024-10-31 -30.957664 2024-11-30 72.575222 2024-12-31 154.907163
`resample`関数を用いてデータを年単位にリサンプリングし、それぞれの年の最大値を求めています。
print(df.resample('Y').max())
print(df.resample('Y').max())
print(df.resample('Y').max())
この最大値というのは、その年の間での ‘A’ 列の最大値を指します。 データはランダムで生成されているため、最大値そのものは実行のたびに異なる値になります。
                     A
2023-12-31  174.945474
2024-12-31  157.463407
A
2023-12-31 174.945474
2024-12-31 157.463407
A 2023-12-31 174.945474 2024-12-31 157.463407