- 問題
- 答え
- 解説
Python コード:
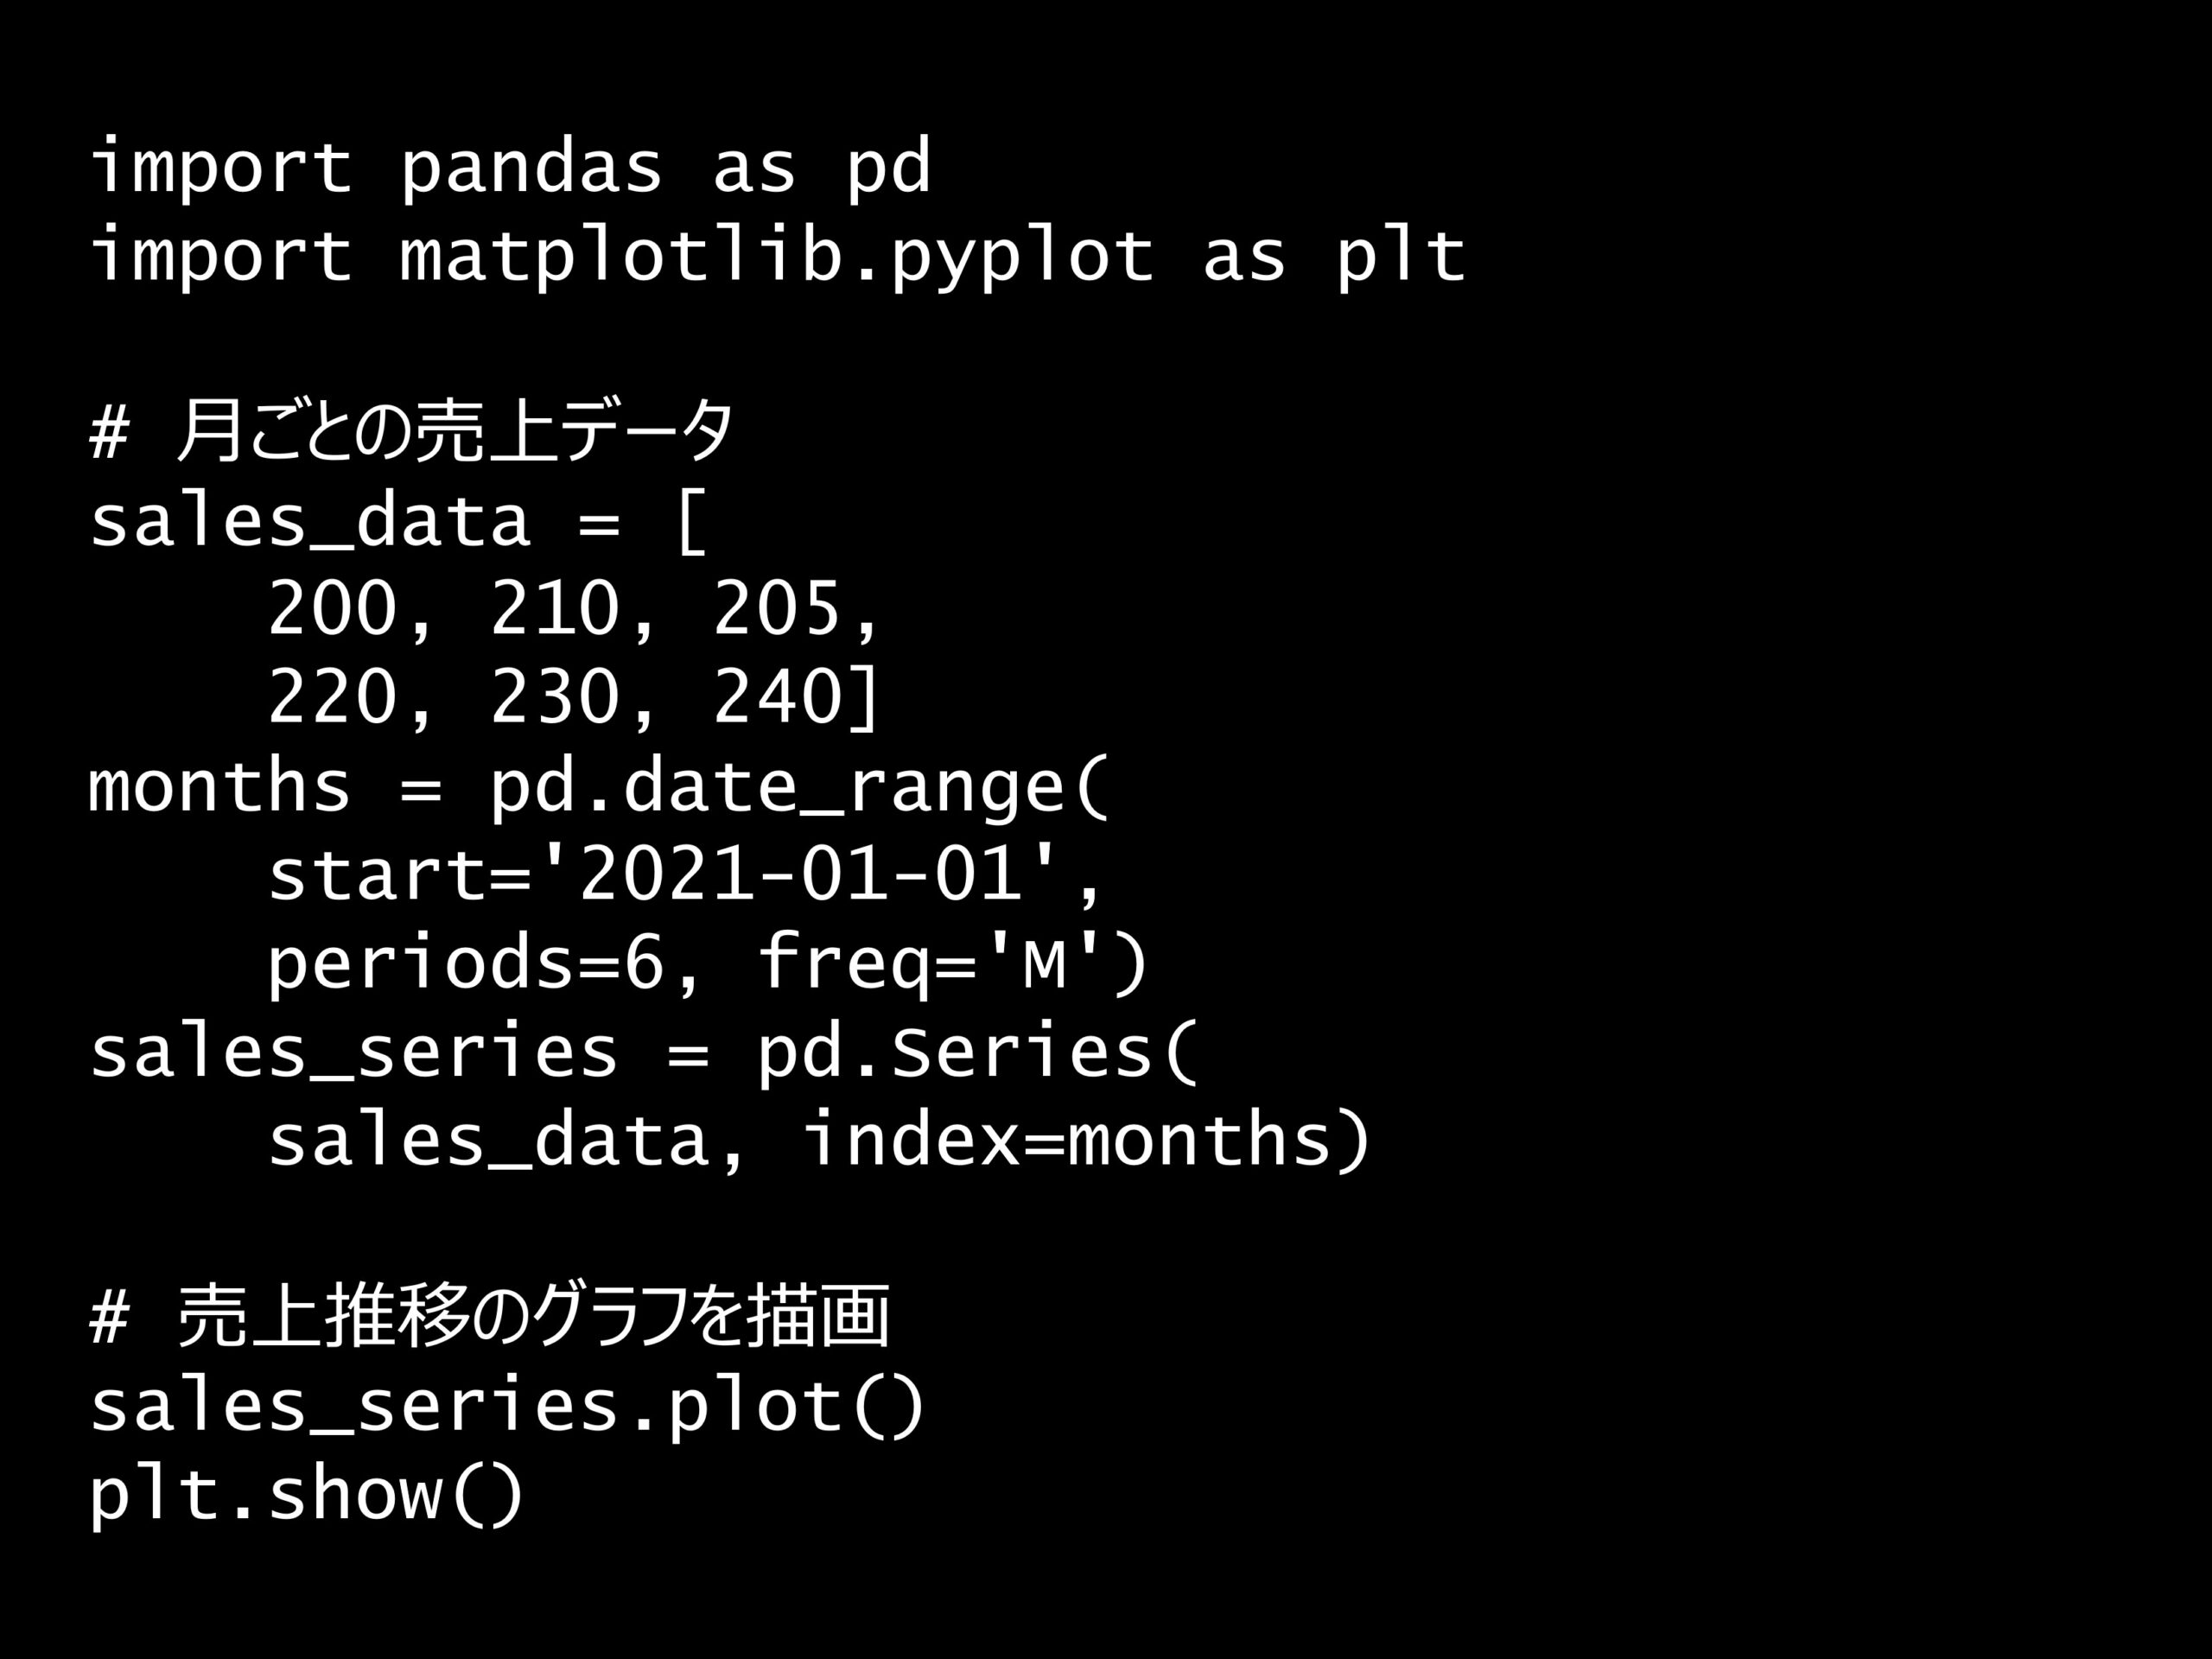
import pandas as pd
import matplotlib.pyplot as plt

# 月ごとの売上データ
sales_data = [
    200, 210, 205,
    220, 230, 240]
months = pd.date_range(
    start='2021-01-01',
    periods=6, freq='M')
sales_series = pd.Series(
    sales_data, index=months)

# 売上推移のグラフを描画
sales_series.plot()
plt.show()
回答の選択肢:
(A) 売上データの棒グラフ
(B) 売上データの面グラフ
(C) 売上データのヒストグラム
(D) 売上データの折れ線グラフ

正解: (D)
回答の選択肢:
(A) 売上データの棒グラフ
(B) 売上データの面グラフ
(C) 売上データのヒストグラム
(D) 売上データの折れ線グラフ
- コードの解説
-
このコードは、月ごとの売上データを可視化するためのグラフを描画します。Plain textCopy to clipboardOpen code in new windowEnlighterJS 3 Syntax Highlighterimport pandas as pdimport matplotlib.pyplot as plt# 月ごとの売上データsales_data = [200, 210, 205,220, 230, 240]months = pd.date_range(start='2021-01-01',periods=6, freq='M')sales_series = pd.Series(sales_data, index=months)# 売上推移のグラフを描画sales_series.plot()plt.show()import pandas as pd import matplotlib.pyplot as plt # 月ごとの売上データ sales_data = [ 200, 210, 205, 220, 230, 240] months = pd.date_range( start='2021-01-01', periods=6, freq='M') sales_series = pd.Series( sales_data, index=months) # 売上推移のグラフを描画 sales_series.plot() plt.show()
import pandas as pd
import matplotlib.pyplot as plt

# 月ごとの売上データ
sales_data = [
    200, 210, 205,
    220, 230, 240]
months = pd.date_range(
    start='2021-01-01',
    periods=6, freq='M')
sales_series = pd.Series(
    sales_data, index=months)

# 売上推移のグラフを描画
sales_series.plot()
plt.show()
詳しく説明します。
まず、6か月間の売上データをリストとして定義しています。
Plain textCopy to clipboardOpen code in new windowEnlighterJS 3 Syntax Highlightersales_data = [200, 210, 205, 220, 230, 240]sales_data = [200, 210, 205, 220, 230, 240]sales_data = [200, 210, 205, 220, 230, 240]
2021年1月1日から始まる6か月間の月末の日付を生成しています。
freq='M'は月末を意味します。Plain textCopy to clipboardOpen code in new windowEnlighterJS 3 Syntax Highlightermonths = pd.date_range(start='2021-01-01', periods=6, freq='M')months = pd.date_range(start='2021-01-01', periods=6, freq='M')months = pd.date_range(start='2021-01-01', periods=6, freq='M')
monthsに格納されているデータは以下です。DatetimeIndex(['2021-01-31', '2021-02-28', '2021-03-31', '2021-04-30', '2021-05-31', '2021-06-30'], dtype='datetime64[ns]', freq='M')sales_dataリストとmonthsの日付範囲を結びつけてPandasのSeriesオブジェクトを作成しています。これにより、各月末の売上が日付と結びつけられます。Plain textCopy to clipboardOpen code in new windowEnlighterJS 3 Syntax Highlightersales_series = pd.Series(sales_data, index=months)sales_series = pd.Series(sales_data, index=months)sales_series = pd.Series(sales_data, index=months)
sales_seriesに格納されているデータは以下です。2021-01-31 200 2021-02-28 210 2021-03-31 205 2021-04-30 220 2021-05-31 230 2021-06-30 240 Freq: M, dtype: int64
sales_seriesのデータをプロットし、plt.show()を使ってグラフを表示しています。このグラフは、月ごとの売上の推移を視覚的に示します。Plain textCopy to clipboardOpen code in new windowEnlighterJS 3 Syntax Highlightersales_series.plot()plt.show()sales_series.plot() plt.show()sales_series.plot() plt.show()

- plot()メソッド
-
Pandasの
Seriesオブジェクトに対して様々な種類のグラフを描画するために、plot()メソッドを使用します。このメソッドは、データの視覚化を簡単に行うための強力なツールです。
plot()メソッドで描画できる主なグラフの種類とその使用方法を示していきます。
まず、サンプルデータを作ります。以下、コードです。
Plain textCopy to clipboardOpen code in new windowEnlighterJS 3 Syntax Highlighterimport pandas as pdimport matplotlib.pyplot as plt# サンプルデータの作成sales_A = [150, 170, 160, 190, 180, 175, 160, 174, 165, 180, 201, 150]sales_B = [155, 175, 165, 140, 185, 170, 195, 180, 168, 154, 170, 155]months = pd.date_range(start='2022-01-01', periods=12, freq='M')data = {'A Sales': sales_A, 'B Sales': sales_B}df = pd.DataFrame(data, index=months)df.index = df.index.strftime('%Y-%m')print(df)import pandas as pd import matplotlib.pyplot as plt # サンプルデータの作成 sales_A = [150, 170, 160, 190, 180, 175, 160, 174, 165, 180, 201, 150] sales_B = [155, 175, 165, 140, 185, 170, 195, 180, 168, 154, 170, 155] months = pd.date_range(start='2022-01-01', periods=12, freq='M') data = {'A Sales': sales_A, 'B Sales': sales_B} df = pd.DataFrame(data, index=months) df.index = df.index.strftime('%Y-%m') print(df)import pandas as pd import matplotlib.pyplot as plt # サンプルデータの作成 sales_A = [150, 170, 160, 190, 180, 175, 160, 174, 165, 180, 201, 150] sales_B = [155, 175, 165, 140, 185, 170, 195, 180, 168, 154, 170, 155] months = pd.date_range(start='2022-01-01', periods=12, freq='M') data = {'A Sales': sales_A, 'B Sales': sales_B} df = pd.DataFrame(data, index=months) df.index = df.index.strftime('%Y-%m') print(df)以下、実行結果です。
         A Sales  B Sales
2022-01      150      155
2022-02      170      175
2022-03      160      165
2022-04      190      140
2022-05      180      185
2022-06      175      170
2022-07      160      195
2022-08      174      180
2022-09      165      168
2022-10      180      154
2022-11      201      170
2022-12      150      155
このデータセットを使い例を示していきます。
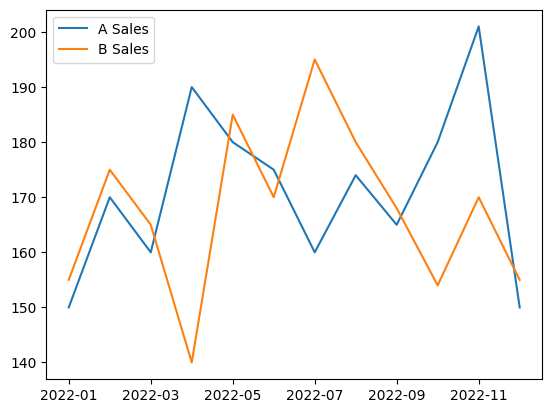
折れ線グラフ (Line Plot)
デフォルトのグラフタイプです。時系列データや連続データの変化を視覚化するのに適しています。
Plain textCopy to clipboardOpen code in new windowEnlighterJS 3 Syntax Highlighter# 折れ線グラフの描画df.plot(kind='line')plt.show()# 折れ線グラフの描画 df.plot(kind='line') plt.show()# 折れ線グラフの描画 df.plot(kind='line') plt.show()
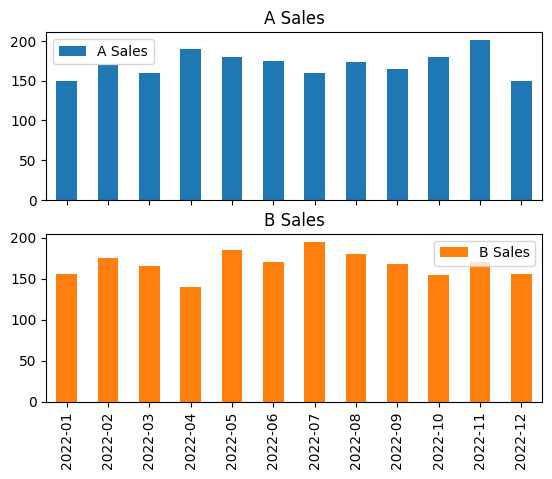
棒グラフ (Bar Plot)カテゴリデータの比較に使用されます。各カテゴリの値を棒で表現します。
subplots=Trueとすると、グラフが個々に表示されます。Plain textCopy to clipboardOpen code in new windowEnlighterJS 3 Syntax Highlighter# 棒グラフの描画df.plot(kind='bar', subplots=True)plt.show()# 棒グラフの描画 df.plot(kind='bar', subplots=True) plt.show()# 棒グラフの描画 df.plot(kind='bar', subplots=True) plt.show()
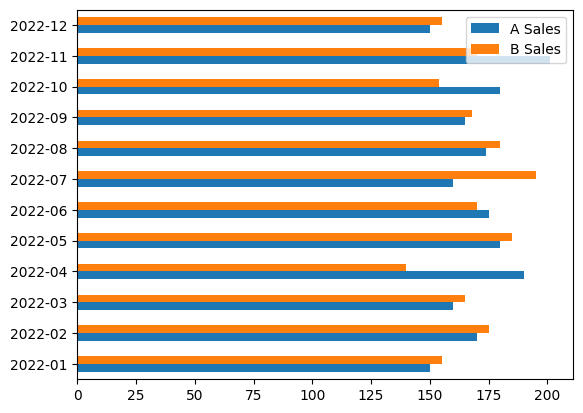
水平棒グラフ (Horizontal Bar Plot)棒グラフの水平バージョンです。カテゴリデータの比較に使用されます。
Plain textCopy to clipboardOpen code in new windowEnlighterJS 3 Syntax Highlighter# 水平棒グラフの描画df.plot(kind='barh')plt.show()# 水平棒グラフの描画 df.plot(kind='barh') plt.show()# 水平棒グラフの描画 df.plot(kind='barh') plt.show()
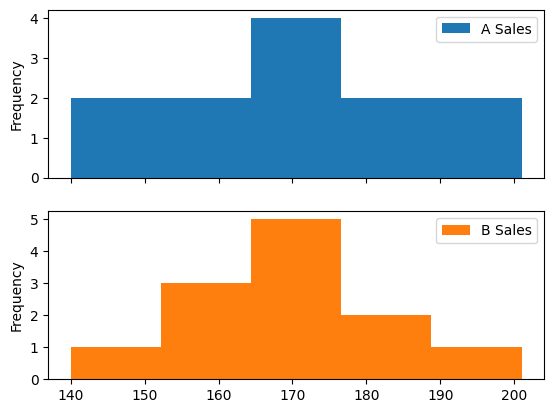
ヒストグラム (Histogram)データの分布を視覚化するのに使用されます。データをビンに分けて、その頻度を棒で表現します。
Plain textCopy to clipboardOpen code in new windowEnlighterJS 3 Syntax Highlighter# ヒストグラムの描画df.plot(kind='hist', bins=5, subplots=True)plt.show()# ヒストグラムの描画 df.plot(kind='hist', bins=5, subplots=True) plt.show()# ヒストグラムの描画 df.plot(kind='hist', bins=5, subplots=True) plt.show()
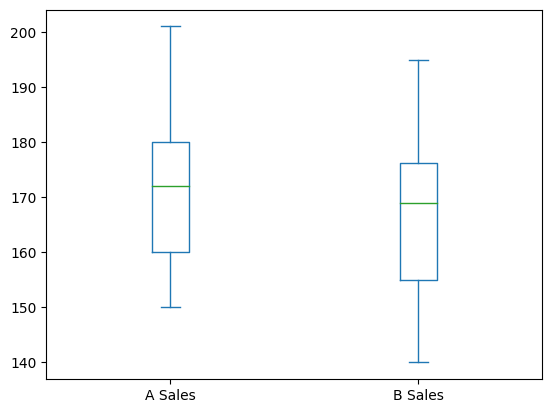
箱ひげ図 (Box Plot)データの分布や外れ値を視覚化するのに使用されます。四分位範囲や中央値を示します。
Plain textCopy to clipboardOpen code in new windowEnlighterJS 3 Syntax Highlighter# 箱ひげ図の描画df.plot(kind='box')plt.show()# 箱ひげ図の描画 df.plot(kind='box') plt.show()# 箱ひげ図の描画 df.plot(kind='box') plt.show()
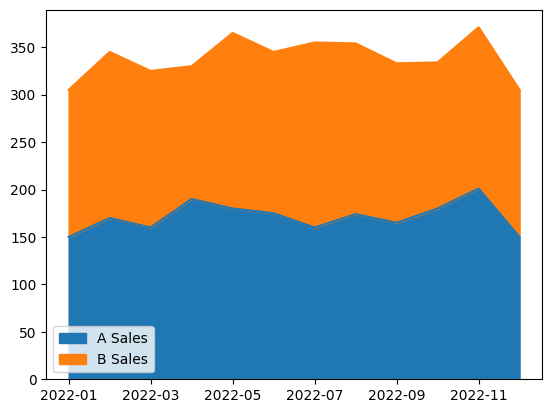
エリアグラフ (Area Plot)折れ線グラフの下の領域を塗りつぶしたグラフです。累積データの変化を視覚化するのに適しています。
Plain textCopy to clipboardOpen code in new windowEnlighterJS 3 Syntax Highlighter# エリアグラフの描画df.plot(kind='area')plt.show()# エリアグラフの描画 df.plot(kind='area') plt.show()# エリアグラフの描画 df.plot(kind='area') plt.show()
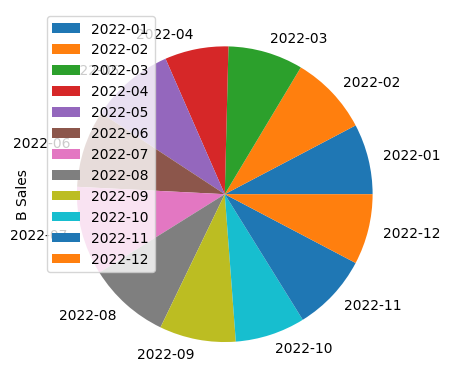
円グラフ (Pie Chart)カテゴリデータの割合を視覚化するのに使用されます。各カテゴリの割合を円のセグメントで表現します。
Plain textCopy to clipboardOpen code in new windowEnlighterJS 3 Syntax Highlighter# 列ごとの円グラフの描画df[['A Sales']].plot(kind='pie', subplots=True)df[['B Sales']].plot(kind='pie', subplots=True)plt.show()# 列ごとの円グラフの描画 df[['A Sales']].plot(kind='pie', subplots=True) df[['B Sales']].plot(kind='pie', subplots=True) plt.show()# 列ごとの円グラフの描画 df[['A Sales']].plot(kind='pie', subplots=True) df[['B Sales']].plot(kind='pie', subplots=True) plt.show()

散布図 (Scatter Plot)2つの変数間の関係を視覚化するのに使用されます。`Series`オブジェクトではなく、`DataFrame`オブジェクトに対して使用されます。
Plain textCopy to clipboardOpen code in new windowEnlighterJS 3 Syntax Highlighter# 散布図の描画df.plot(kind='scatter', x='A Sales', y='B Sales')plt.show()# 散布図の描画 df.plot(kind='scatter', x='A Sales', y='B Sales') plt.show()# 散布図の描画 df.plot(kind='scatter', x='A Sales', y='B Sales') plt.show()
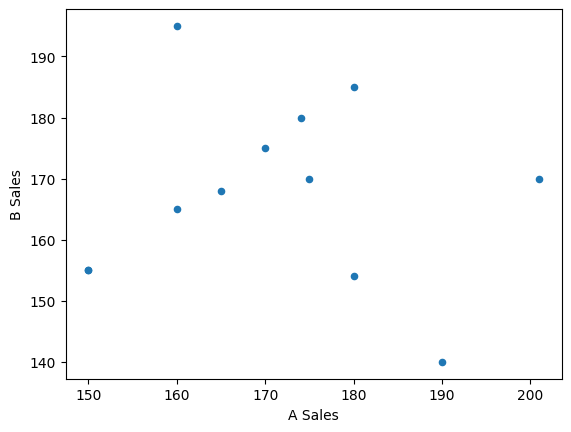
これらのグラフを描画するために、plot()メソッドのkindパラメータを使用してグラフの種類を指定します。例えば、棒グラフを描画する場合は、
kind='bar'を指定します。plot()メソッドは、データの視覚化を簡単に行うための便利な方法を提供します。

